 Global| Jan 09 2006
News from Central and Eastern Europe
Summary
Statistics relating to the Czech Republic, Hungary, Latvia and Slovenia were released today. These countries became members of the European Union in May, 2004 and, while it will be some time before they are able and/or willing to join [...]

Statistics relating to the Czech Republic, Hungary, Latvia and Slovenia were released today. These countries became members of the European Union in May, 2004 and, while it will be some time before they are able and/or willing to join the Euro Zone, it may be interesting to compare the various aspects of their economies with those of the Euro Zone as a whole. The data for these countries are found in the Haver database, EMERGECW.
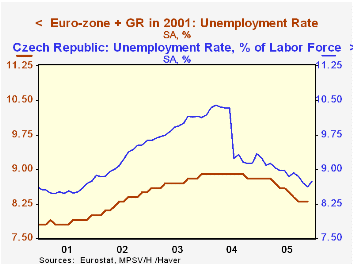
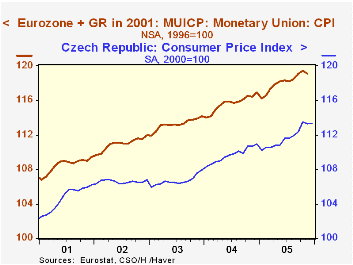
The December CPI and the unemployment rate were released for the Czech Republic. The first two charts compare prices and the unemployment rate in the Czech Republic and in the Euro Zone as a whole. When the harmonized Index of Prices for the Euro Zone, which is published on a 1996=100 basis is put on a 2000=100 basis for comparison with the Czech index, the levels and trends are very similar. The rate of unemployment, however, is higher in the Czech Republic than in the Euro Zone and it was only in mid 2004 that the difference between the two rates began to narrow.
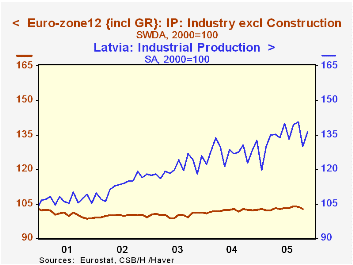
Industrial production in Latvia rose 4.9% in November from October and was almost 6% over November, 2004. As shown in the third chart, the rise in production in Latvia has been much more vigorous than that in the Euro Zone as a whole.
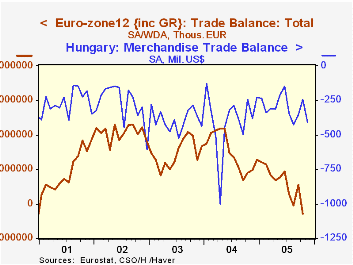
Finally the merchandise trade balance in both Slovenia and Hungary has generally been negative, while that of the Euro Zone has, until recently, been positive. The fourth chart shows the merchandise trade deficit for Hungary and that of the Euro Zone as a whole. 

| Dec 05 | Nov 05 | Dec 04 | M/M % or Dif | Y/Y % or Dif |
2004 | 2003 | 2002 | |
|---|---|---|---|---|---|---|---|---|
| CZECH REPUBLIC | ||||||||
| CPI (2000=100) | 113.4 | 113.3 | 110. | 0.09 | 2.25 | 109.7 | 106.7 | 106.6 |
| Unemployment Rate (%) | 8.75 | 8.63 | 9.34 | 0.12 | -0.59 | 9.77 | 9.92 | 9.19 |
| Nov 05 | Oct 05 | Nov 04 | M/M % or Dif | Y/Y % or Dif | 2004 | 2003 | 2002 | |
| LATVIA | ||||||||
| Industrial Production | 136.2 | 129.2 | 128.6 | 4.93 | 5.99 | 127.7 | 120.5 | 113.1 |
| HUNGARY | ||||||||
| Trade Balance (Mil US$) | -411.7 | -245.4 | -378.7 | -166.3 | -33.0 | -4764.8 | -4667.3 | -3275.1 |
| SLOVENIA | ||||||||
| Trade Balance (Mil US$) | -192.7 | -156.9 | -143.2 | -35.8 | -49.5 | -1456.5 | -1120.7 | -586.5 |
More Economy in Brief
 Global| Feb 05 2026
Charts of the Week: Balanced Policy, Resilient Data and AI Narratives
by:Andrew Cates


