 Global| Oct 27 2008
No Surprise: German Ifo's Business Climate Indicator Continues To Decline
Summary
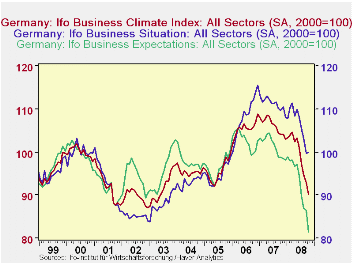
It is no surprise, given the world economic turmoil that German firms have become increasingly pessimistic regarding their economic outlook. The IFO Business climate indicator fell 2.9% to 90.2 (2000=100) in October from 92.9 in [...]

It is no surprise, given the world economic turmoil that
German firms have become increasingly pessimistic regarding their
economic outlook. The IFO Business climate indicator fell 2.9% to 90.2
(2000=100) in October from 92.9 in September. The indicator is now
approaching the lows last reached in 2001 and 2002.The Business Climate
Indicator is based on the responses of some 7000 firms in the
manufacturing, construction, wholesale and retail trade industries to
questions regarding current conditions and expected conditions over the
next six months. In the current survey, the index for current
conditions increased minimally by 0.1%,while the index for expectations
declined 5.9%. The indexes for the business climate, current conditions
and expectations for the next six months are shown in the first chart.
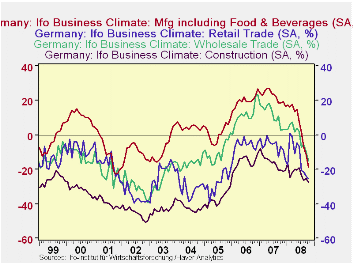
In addition to the indexes, the data are also shown as percentage balances of good versus poor for current conditions and more favorable versus less favorable for expectations. The percentage balances for the business climate in the manufacturing, construction, wholesale and retail trade industries are shown in the second chart. All the indicators have been declining since the sub prime problem arose in the United States in the Fall of 2007, but the declines in manufacturing and retail trade appear to have accelerated in the past few months.
| GERMANY IFO BUSINESS CLIMATE | Oct 08 | Sep 08 | Oct 07 | M/M %chg | Y/Y chg | 2007 | 2006 | 2005 |
|---|---|---|---|---|---|---|---|---|
| INDEXES (2000=100) | ||||||||
| Climate | 90.2 | 92.9 | 104.1 | -2.91 | -13.35 | 106.2 | 105.4 | 95.5 |
| Current Conditions | 99.9 | 99.8 | 109.7 | 0.10 | -8.93 | 111.2 | 108.4 | 94.7 |
| Expectations for Next Six Months | 81.4 | 86.5 | 98.8 | -5.90 | -17.61 | 101.4 | 102.7 | 96.3 |
| PERCENT BALANCES (%) | Pt chg | |||||||
| Industry | -20.2 | -14.9 | 7.5 | -5.3 | -27.7 | 11.6 | 10.2 | -9.6 |
| Manufacturing | -18.9 | -11.9 | 18.4 | -7.2 | -37.3 | 22.4 | 19.8 | 1.3 |
| Construction | -27.6 | -25.2 | -20.3 | -2.4 | -7.3 | -16.1 | -15.8 | -37.0 |
| Wholesale Trade | -15.1 | -10.3 | 2.6 | -4.8 | -17.7 | 11.1 | 11.7 | -9.8 |
| Retail Trade | -25.0 | -24.1 | -6.4 | -0.9 | -18.6 | -6.5 | -6.0 | -28.0 |
More Economy in Brief
 Global| Feb 05 2026
Charts of the Week: Balanced Policy, Resilient Data and AI Narratives
by:Andrew Cates


