Global| Dec 12 2005
OECD Leaders Rose Further
by:Tom Moeller
|in:Economy in Brief
Summary
The Leading Index of the Major 7 OECD economies posted its fifth consecutive monthly increase in October with a 0.4% increase that doubled the gains of the prior two months. The increase raised the leaders' six month growth rate to [...]
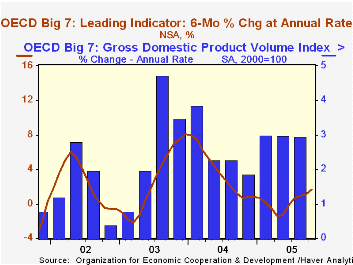
The Leading Index of the Major 7 OECD economies posted its fifth consecutive monthly increase in October with a 0.4% increase that doubled the gains of the prior two months. The increase raised the leaders' six month growth rate to 1.7%, the best since August 2004 and gains were broad based amongst countries.
During the last ten years there has been a 66% correlation between the change in the leading index and the q/q change in the GDP Volume Index for the Big Seven countries in the OECD.
The leading index for Japan jumped 0.9% after a downwardly revised 0.5% September increase. Share prices and construction rose lifting the six month growth rate to a firm 3.0% and its correlation with real economic growth in Japan has been a meaningful 42% during the last ten years.
Leaders in the European Union (15 countries) rose 0.3%. This fifth consecutive monthly increase raised the six month growth rate to 2.5%. During the last ten years there has been a 60% correlation between the change in the leading index and the q/q change in the GDP volume index for the European Union.
German leaders increased for the six consecutive month and a 0.7% gain was the strongest since July. The six month growth rate improved to 4.4% as new orders rose to the highest since 1992. The correlation between the leaders and the change in the German GDP volume index has been a low 19% during the last ten years.
The French leaders increased 0.5% increase and the gain pulled the six month growth rate further into positive territory at 1.5%. Prospects for the industrial sector rose to the best level in a year. The correlation between the leaders' growth and France's GDP volume index has been 43% during the last ten years. The Italian leading index were unchanged following two months of increase. Nevertheless, the six month growth rate improved to 0.3% though earlier growth rates were revised down. Its correlation with GDP growth has been a low 0.9% during the last ten years.
The U.S. leaders rose 0.2% following two months of decline and six month growth in the leaders improved to a modest 1.2%. The correlation between the leaders and real GDP growth has been a high 58% during the last ten years.
The UK leaders fell 0.1% for the second straight month. Declines in consumer confidence, new car registrations, share prices and the future tendency of production dropped the six month growth rate to -0.3% and its correlation with real GDP growth has been 29% during the last ten years. The Canadian leaders also fell for the second month and the 0.1% decline dropped six month growth to -0.8%. The correlation of the leaders' growth with Canadian real GDP has been 49% during the last ten years.
The latest OECD Leading Indicator report is available here.
Cross-Country Productivity Growth from the Federal Reserve Bank of St. Louis is available here.
| OECD | Oct | Sept | Y/Y | 2004 | 2003 | 2002 |
|---|---|---|---|---|---|---|
| Composite Leading Index | 103.37 | 102.99 | 1.0% | 102.36 | 97.84 | 96.45 |
| 6 Month Growth Rate | 1.7% | 1.1% | 3.6% | 2.7% | 2.3% |
by Tom Moeller December 12, 2005
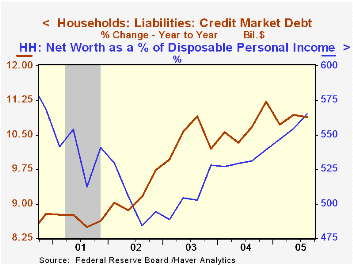
Growth in credit market debt owed by the household sector jumped at a 13.3% rate last quarter, the strongest rate in a year. A 15.5% (13.2% y/y) jump in mortgage obligations lifted the figure but consumer credit also surged at an 8.7% rate (4.2% y/y), the strongest this year. These gains powered overall domestic nonfinancial debt growth to its fastest of the year, 9.8% (9.2% y/y)
Growth in the federal government debt also was firm at 6.9% y/y while non-financial corporations' debt grew a faster 7.7% y/y.
Household sector asset values rose 12.8% y/y due to a 14.1% rise in the value of real estate holdings. Financial asset values rose 9.8% due to a 19.0% rise in the value of mutual fund shares but the value of corporate equities held directly rose just 3.0%.
The net worth of the US household sector in 3Q improved 2.6% (10.9% y/y) to a record $51.1 trillion. The gain lifted net worth to a historic 5.6 times income.
| Flow of Funds | % of Total | 3Q 05 (AR) |
2Q 05 (AR) |
Y/Y | 2004 |
2003 |
2002 |
|---|---|---|---|---|---|---|---|
| Total Credit Market Debt Outstanding | 8.7% | 8.8% | 8.7% | 8.4% | 8.8% | 7.7% | |
| Federal Government | 12% | 6.6% | -3.7% | 6.9% | 9.0% | 10.9% | 7.6% |
| Households | 28% | 13.3% | 12.0% | 10.9% | 11.2% | 10.2% | 9.7% |
| Nonfinancial Corporate Business | 14% | 6.5% | 8.7% | 7.7% | 5.2% | 3.4% | 0.5% |
| Financial Sectors | 32% | 6.1% | 10.7% | 7.5% | 7.5% | 10.1% | 9.2% |
| Net Worth: Households & Nonprofit Organizations (Trillions) | $51.1 | $49.8 | $48.2 | $43.9 | $39.0 | ||
| Tangible Assets | $20.8 | $20.1 | 14.1% | $18.7 | $16.4 | $15.0 |
by Louise Curley December 12, 2005
The second preliminary estimate of Japan's third quarter gross domestic product, which was published late last week, reduced the quarter-to-quarter growth rate from 0.4% to 0.2%. The major revision was a change in inventory accumulation. In the first preliminary estimate there was no change in inventories and, therefore no contribution to growth from that source, but the second preliminary estimate showed a substantial decline in inventories resulting in 0.4 percentage points being deducted from the growth rate.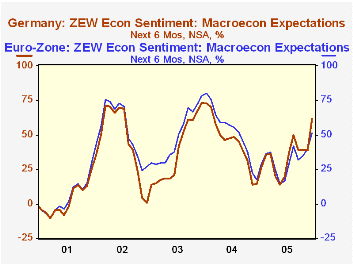 The other changes were a 0.1 percentage point increase in nonresidential construction and a 0.1 percentage point reduction in the import of goods and service import which, of course, is positive in relation to growth. On a seasonally adjusted annual rate basis, Japan's GDP rose 1.0% in the third quarter, down from 5.0% in the second quarter and 5.7% in the first quarter as shown in the first chart.
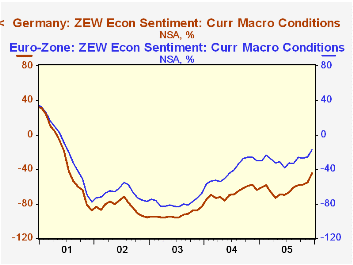
The fact that the lower estimate was due largely to a change in the estimate for inventories suggests that the deceleration in growth may not herald the specter of another false rise in Japanese growth. There are faint positive stirrings in consumer confidence. Although the diffusion index of consumer confidence is still below 50, indicating an excess of pessimists over optimists, the index has risen in both October and November suggesting that consumers may increase their spending in the fourth quarter. The Economic and Social Research Institute in the Cabinet Office now publishes monthly instead of quarterly indicators of consumer confidence, but the monthly data go back only to April, 2004. In the second chart we show the monthly data linked to the now discontinued quarterly series. While the gains in consumer confidence are tentative, there is little doubt that there has been a sharp decline in the yen this year as shown in the third chart. The lower yen has and is likely to continue to encourage exports.
| Japanese Gross Domestic Product (Billions chained 2000 Yen) |
Q3 05 % | Q2 05 % | Q1 05 % | 2004 % | 2003 % | 2002 % |
|---|---|---|---|---|---|---|
| Gross Domestic Product SA Annual Rate | 1.00 | 4.96 | 5.67 | 2.26 | 1.82 | 0.14 |
| Q/Q % | 0.25 | 1.22 | 1.39 | 2.26 | 1.82 | 0.14 |
| Household Consumption | 0.37 | 0.32 | 1.21 | 1.91 | 0.57 | 1.11 |
| Government Consumption | 0.56 | 0.23 | 0.93 | 2.00 | 2.30 | 2.38 |
| Gross Fixed Investment | 1.33 | 1.40 | 1.81 | 0.95 | 0.47 | -4.95 |
| Exports | 0.72 | 3.10 | -0.14 | 13.93 | 9.00 | 7.45 |
| Imports | 3.34 | 2.15 | -0.04 | 8.47 | 3.95 | 0.81 |
| Change in Inventories (Billions chained 2000 Yen) |
||||||
| Private | -1,915.3 | 1,539.2 | 727.3 | -1,199.6 | 1,750.7 | -2,055.9 |
| Government | 32.9 | -15.4 | -48.4 | 60.3 | 11.2 | 15.1 |

Tom Moeller
AuthorMore in Author Profile »Prior to joining Haver Analytics in 2000, Mr. Moeller worked as the Economist at Chancellor Capital Management from 1985 to 1999. There, he developed comprehensive economic forecasts and interpreted economic data for equity and fixed income portfolio managers. Also at Chancellor, Mr. Moeller worked as an equity analyst and was responsible for researching and rating companies in the economically sensitive automobile and housing industries for investment in Chancellor’s equity portfolio. Prior to joining Chancellor, Mr. Moeller was an Economist at Citibank from 1979 to 1984. He also analyzed pricing behavior in the metals industry for the Council on Wage and Price Stability in Washington, D.C. In 1999, Mr. Moeller received the award for most accurate forecast from the Forecasters' Club of New York. From 1990 to 1992 he was President of the New York Association for Business Economists. Mr. Moeller earned an M.B.A. in Finance from Fordham University, where he graduated in 1987. He holds a Bachelor of Arts in Economics from George Washington University.