 Global| Dec 10 2012
OECD Leading Indicators: A Mixed Bag
Summary
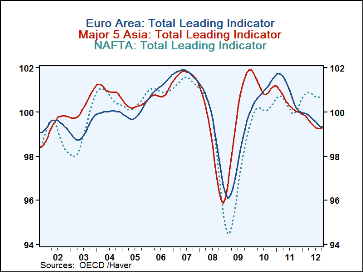
The OECD's Leading Indicator for three broad groups of countries are showing mixed trends, as shown in the attached chart. Those for the Euro Area are definitely indicating slowing economies. Except for Germany, most of the other [...]
 The OECD's Leading Indicator for three broad groups of
countries are showing mixed trends, as shown in the attached chart.
Those for the Euro Area are definitely indicating slowing economies.
Except for Germany, most of the other countries in the area are showing
declining leading indicators. Those for the Asia Major Five--China,
India, Indonesia, Japan and Korea--have improved slightly from September
to October, but are 0.73% below October of a year ago. Japan may be
the culprit here. Its GDP has declined in the second and third
quarters. The October leading indicators for NAFTA--United States, Canada
and Mexico--are 0.5% above September and 0.72% above October 2011.
The leading indicators have proved effective in forecasting economic trends. The current indicators are pointing to a recession in the Euro Area, but only a slow down in Asia, ex Japan and some further growth in the NAFTA countries..
| Weekly Price | Oct '12 | Sep '12 | Oct '11 | Y/Y % | M/M % | 2011 | 2010 | 2009 |
|---|---|---|---|---|---|---|---|---|
| Euro Area | 99.31 | 99.36 | 100.19 | -0.05 | -0.88 | 100.96 | 100.90 | 97.72 |
| Asia Major 5 | 99.29 | 99.25 | 100.02 | 0.03 | -0.73 | 100.42 | 101.21 | 99.53 |
| NAFTA | 100.73 | 100.68 | 100.01 | 0.05 | 0.72 | 100.33 | 100.12 | 96.55 |
More Economy in Brief
 Global| Feb 05 2026
Charts of the Week: Balanced Policy, Resilient Data and AI Narratives
by:Andrew Cates


