 Global| Jun 08 2009
OECD Leading Indicators: Signs of Recovery
Summary
For the second month in a row there was a rise in the April estimate of the OECD composite leading indicator for all 29 countries, suggesting that, on average, the pace of economic deterioration may be slowing in the major [...]

For the second month in a row there was a rise in the April
estimate of the OECD composite leading indicator for all 29 countries,
suggesting that, on average, the pace of economic deterioration may be
slowing in the major industrialized countries. (Not all of the 29
countries have reported.)Among those that have reported, there are,
however, considerable differences in the CLI's for individual
countries.In general western Europe is doing better than Central and
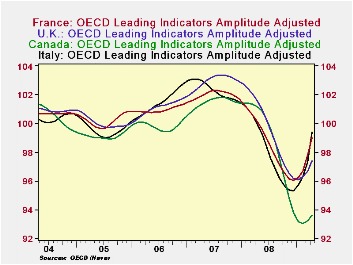
Eastern Europe. The leading indicators of Canada, Italy, France and the
United Kingdom were up in March and April, as shown in the first chart. Although data for April are not yet available for South Korea, it has
shown increases in its CLI in every month from November, 2008 to March
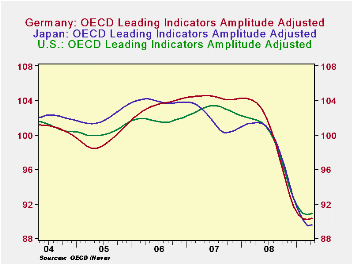
of this year. The CLI's in Germany, Japan and the United States posted
their first increases in this cycle in April, as shown in the second
chart.
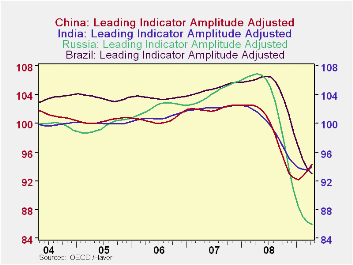
The OECD also computes composite leading indicators for six transition economies. Among them are the BRIC countries, Brazil, Russia, India and China. The CLI for China has increased in March and April, while that for India first increased in April. The CLI's for Brazil and Russia are still declining, although at somewhat lower rates.
 The Composite Leading Indicators (amplitude adjusted) are the
series generally quoted in the press. These are designed to provide
early signals of turning points in business cycles. Their construction
is complicated and a complete description of the methodology can be
foundhere.Essentially,
a selection is made of times series that have similar cyclical
fluctuations to those of the business cycle ,but importantly, precede
those of the business cycle. These series are filtered in a number of
processes, de-trended and finally normalized. The normalization process
involves subtracting from the "filtered " observations the mean of the
series, and dividing this by the mean absolute deviation of the series,
and by adding 100 to each observation. According to the OECD, their
composite leading indicators provide qualitative rather than
quantitative information on short-term economic movements. Four
cyclical phases form the basis of this qualitative approach. Expansion:
CLI increasing and above 100. Downturn:
CLI decreasing and above 100. Slowdown:
CLI decreasing and below 100. Recovery:
CLI increasing and below 100.
The CLI's of South Korea, Canada, France Italy, United Kingdom and China suggest that these countries may to be in the early stages of recovery. United States, Germany Japan and India may be in an even earlier stage.
| OECD LEADING INDICATORS | Apr 09 | Mar 09 | Feb 08 | Jan 09 | Apr/Mar Points | Mar/Feb Points |
|---|---|---|---|---|---|---|
| 30 Members of OECD | 93.2 | 92.7 | 92.6 | 92.9 | 0.5 | 0.1 |
| Canada | 93.6 | 93.2 | 93.0 | 93.2 | 0.4 | 0.2 |
| France | 99.0 | 97.8 | 96.7 | 96.2 | 1.2 | 1.1 |
| Italy | 99.4 | 97.3 | 96.3 | 96.7 | 2.1 | 1.0 |
| U. K. | 97.4 | 96.7 | 96.3 | 96.1 | 0.7 | 0.4 |
| Germany | 90.3 | 90.2 | 90.3 | 90.8 | 0.1 | -0.1 |
| Japan | 89.5 | 89.4 | 90.2 | 91.3 | 0.1 | -0.8 |
| U.S. | 90.9 | 90.7 | 90.9 | 91.5 | 0.2 | -0.2 |
| India | 93.9 | 93.5 | 93.6 | 93.8 | 0.4 | -0.1 |
| China | 94.3 | 93.4 | 92.6 | 92.2 | 0.9 | 0.8 |
| Brazil | 92.9 | 93.6 | 95.0 | 96.7 | -0.7 | -1.4 |
| Russia | 85.9 | 86.2 | 87.0 | 88.4 | -0.3 | -0.8 |
More Economy in Brief
 Global| Feb 05 2026
Charts of the Week: Balanced Policy, Resilient Data and AI Narratives
by:Andrew Cates


