 Global| Apr 21 2009
Optimists Exceed Pessimists Among German Investors And Analysts For The First Time Since July 2007
Summary
For the first time since July 2007 when wind of the sub prime mortgage crisis in the United States began to surface, there were more optimists than pessimists among German analysts and institutional investors regarding the outlook six [...]
 For the first time since
July 2007 when wind of the sub prime mortgage
crisis in the United States began to surface, there were more optimists
than pessimists among German analysts and institutional investors
regarding the outlook six months ahead. The ZEW Center for
European Economic Research at Mannheim reported today that its measure
of investor expectations (the percent balance between positive and
negative opinions) rose from -3.5% to +13%. The excess of
optimists is, however, well below the 71.0% reached in January, 2006
and also the historical average of 26.1%. It is
however, encouraging.
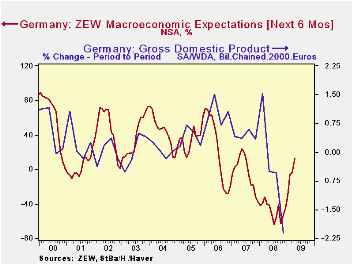
  The ZEW expectation indicator has
performed reasonably well in heralding changes in German GDP and their
magnitudes, as can be seen in the first chart.
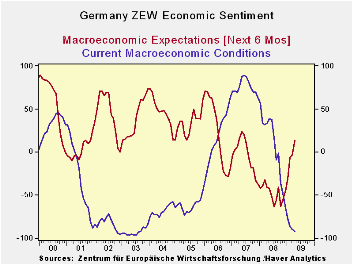
While there was an improvement in expectations among the participants in the survey, there was a worsening in their appraisal of the current conditions. The excess of pessimists over optimists rose to 91.6% from 89.4%. An excess of pessimists this large was last seen in September, 2003. The second chart shows the balances of opinion on expectations and current conditions.
 The ZEW
survey also includes the participants' expectations for profits in a
number of industries. In general the balances of opinion on
profit expectations also turned negative around August, 2007 and became
more and more negative until the last few months. Since then,
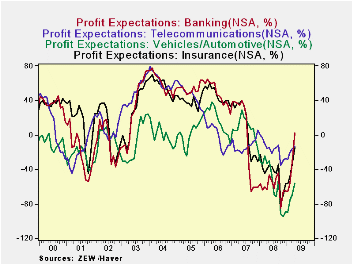
most balances of opinion have become less negative. The
exception is the expectation for profits in the banking industry where
the optimists exceed the pessimists by 2% for the first time since July
2007. The third chart shows the profit expectations for the
banking industry and a few other industries.
| ZEW INDICATORS (% balance) | Apr 09 | Mar 09 | Previous Low | Date | Previous High | Date |
|---|---|---|---|---|---|---|
| Expectations | 13.0 | -3.5 | -63.9 | Jul 08 | 71.0 | Jan 06 |
| Current Conditions | -91.6 | -89.4 | -91.7 | Sep 03 | 88.7 | Jun 07 |
| Profit Expectations | ||||||
| Banking | 2.0 | -31.6 | ||||
| Telecommunications | -13.0 | -16.1 | ||||
| Vehicles/Automotive | -56.1 | -70.2 | ||||
| Insurance | -15.1 | -34.2 |


