 Global| May 26 2020
Our Exploding National Debt – How Will It Be Managed Post-Covid?
Summary
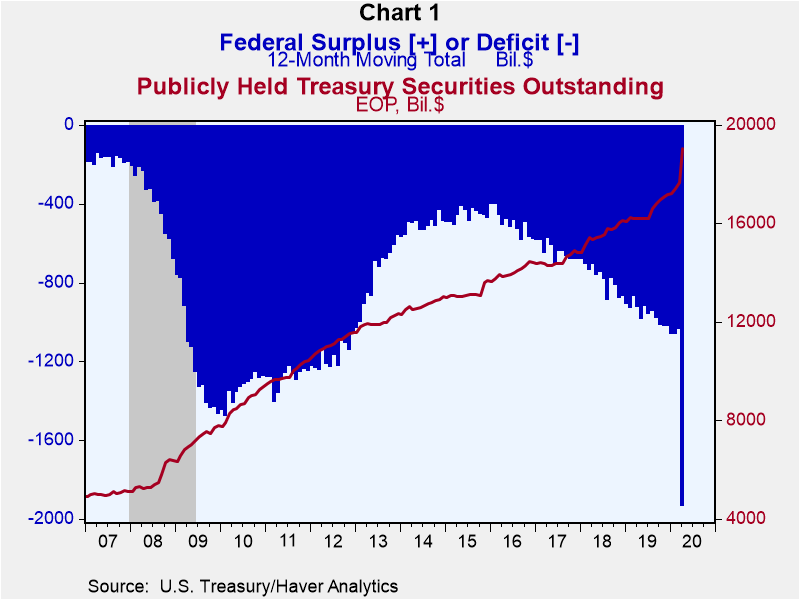
In the 12 months ended April 2020, the cumulative federal budget deficit reached $1.935 trillion, up from $1.0 trillion in the 12 months ended March 2020. The federal debt held by the public at the end of April 2020 stood at $19.054 [...]
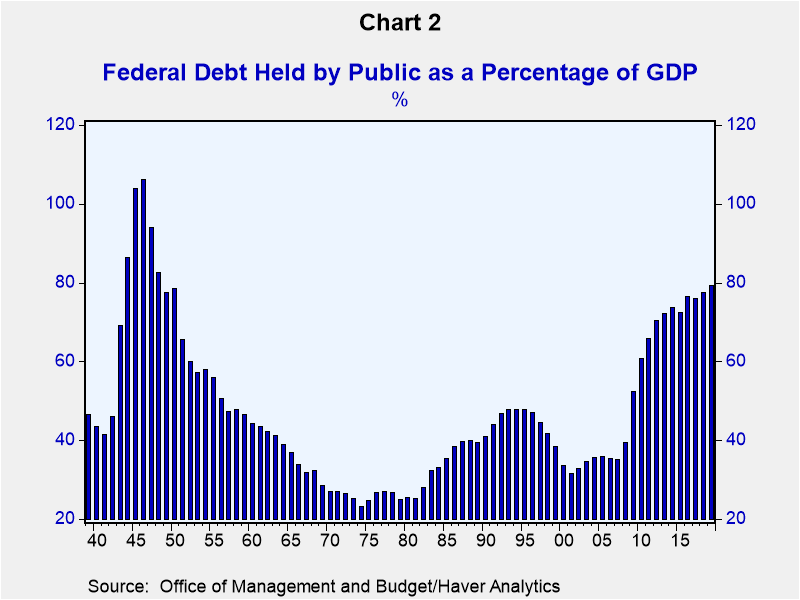
In the 12 months ended April 2020, the cumulative federal budget deficit reached $1.935 trillion, up from $1.0 trillion in the 12 months ended March 2020. The federal debt held by the public at the end of April 2020 stood at $19.054 trillion. (These data are shown in Chart 1.) April's outstanding federal debt represented 88.5% of first-quarter nominal GDP. At the end of fiscal year 2019, total outstanding debt represented 79.2% of nominal GDP. Since 1939, the highest ratio of federal debt to GDP occurred in 1946 at 106% (see Chart 2). Given the Congressional Budget Office's (CBO's) May 19, 2020 forecast of an 11.5% not annualized contraction in nominal GDP, April's outstanding federal debt would be at 100% of nominal GDP.
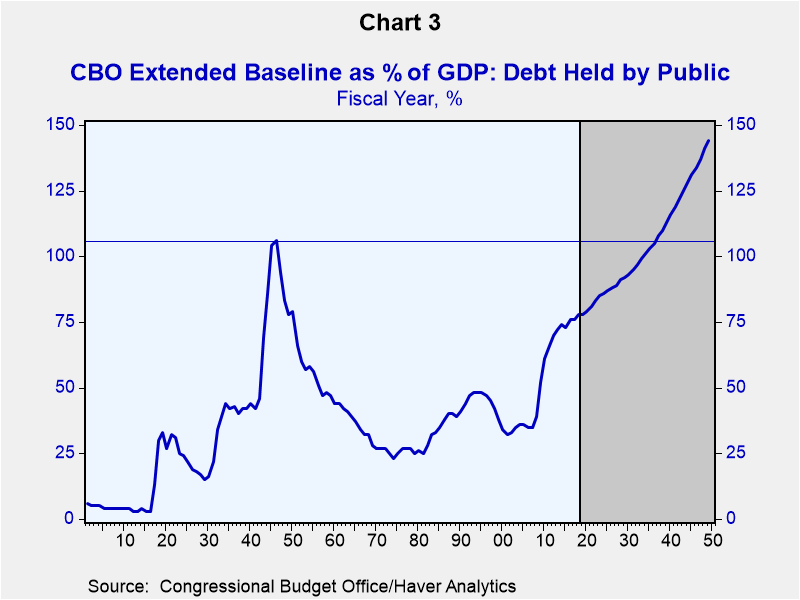 Before the COVID-19 pandemic hit, the US was facing a federal fiscal environment that, according to the CBO, was on a course to push the ratio of federal debt to GDP above the 1946 high. Plotted in Chart 3 is publicly-held federal debt as a percent of fiscal-year nominal GDP from 1901 through 2049, with the period 2019 through 2049 (the gray-shaded area) being a forecast made by the CBO in September 2019. This CBO forecast is based on the laws in place as of September 2019 relating to federal government expenditures and revenues. The forecast shows that in 2037 federal debt as a percent of nominal GDP is forecast to surpass the previous high of 106% set in 1946 and continue higher through the end of the forecast period. Yes, this is a forecast. Yes, laws could be changed to put the debt-to-GDP ratio on a lower course. But the point of this exercise is to show that before the COVID-19 pandemic hit, the path of our national debt was ever rising in not only absolute terms, but, more importantly, in relative terms to our nominal GDP. Given that the ratio of publicly-held federal debt-to-nominal GDP ratio already is at 100% because of the COVID-19-related surge in the federal deficit, this ratio will take out the 1946 high of 106% a lot sooner than 2037.
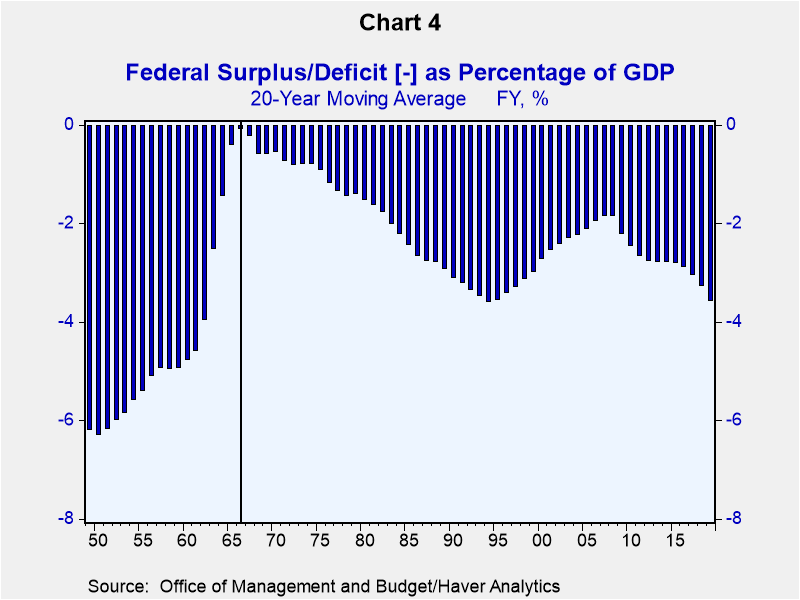
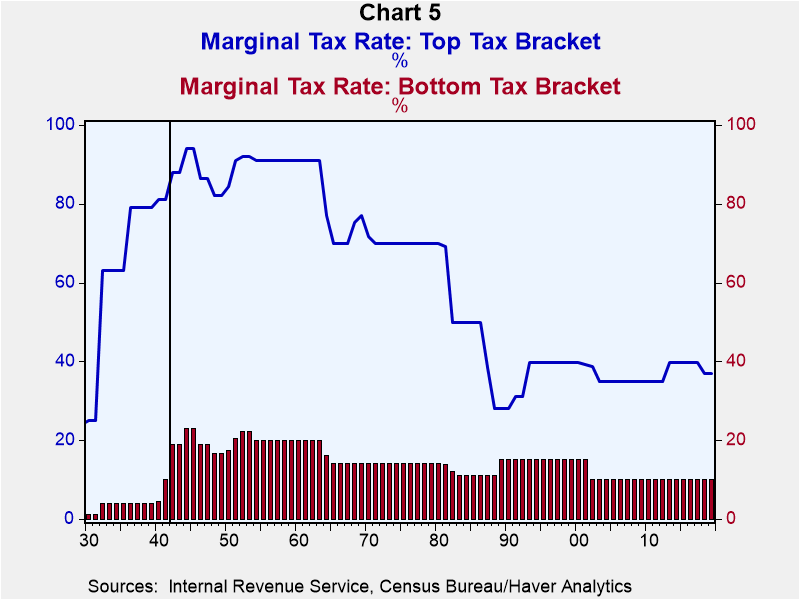
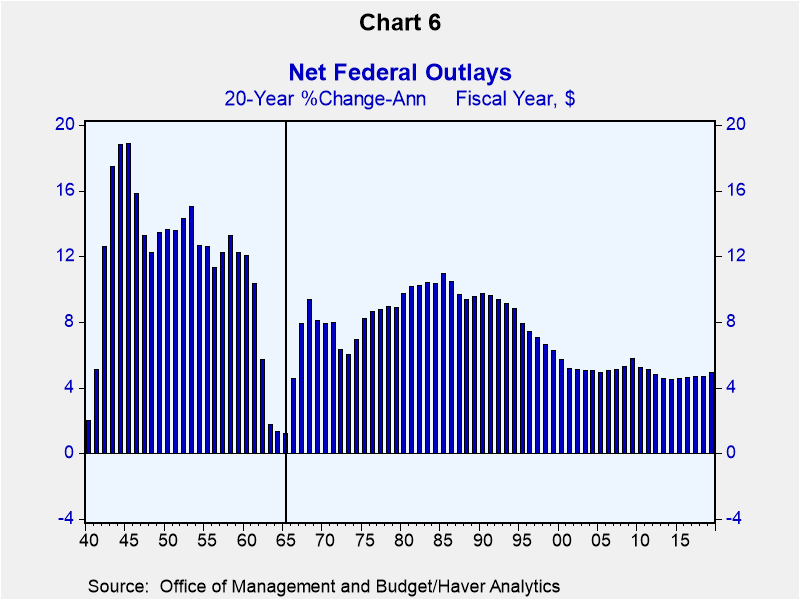
Given that we will soon be at or above WWII levels of national debt relative to GDP, it might be instructive to review how the debt-to-GDP ratio was brought down after the war. As can be seen in Charts 2 and 3, the federal debt-to-nominal GDP ratio hit a post-WWII low of 23.2% in fiscal year 1974. What factors contributed to this decline in this ratio during this period? For starters, the federal government ran small budget deficits relative to nominal GDP. Chart 4 shows that the 20-year moving average of the federal budget deficit as a percent of nominal GDP reached a post-WWII minimum of 0.1% in fiscal year 1966. How did the Treasury accomplish this narrowing in its budget deficit relative to nominal GDP? For starters, personal federal income-tax rates were raised in 1942 after the breakout of WWII and stayed above their pre-war levels until 1964 (see Chart 5). So, income-tax rates remained high in order to generate revenues to help narrow the Treasury budget deficit. In addition to keeping marginal income-tax rates high, Congress showed restraint in federal spending. As shown in Chart 6, the annualized growth in federal outlays slowed to a post-WWII low rate of 1.2% in the 20 years ended 1965.
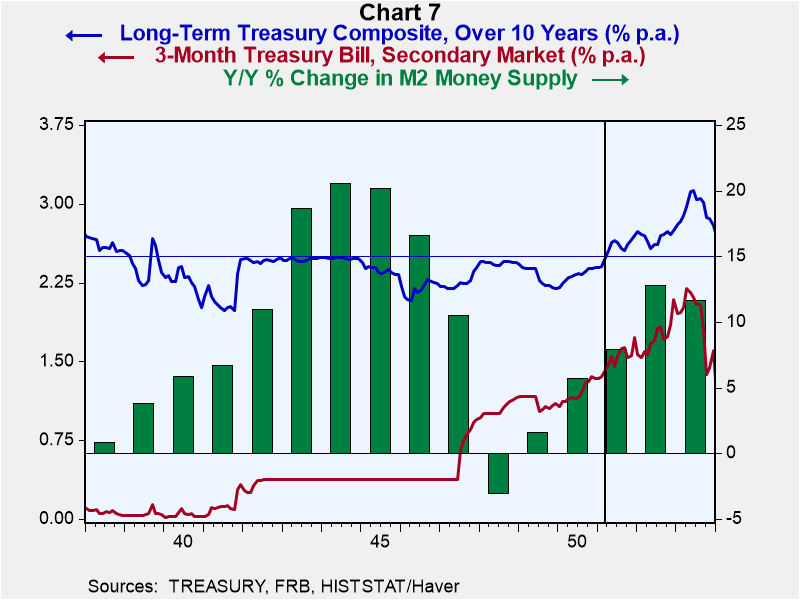
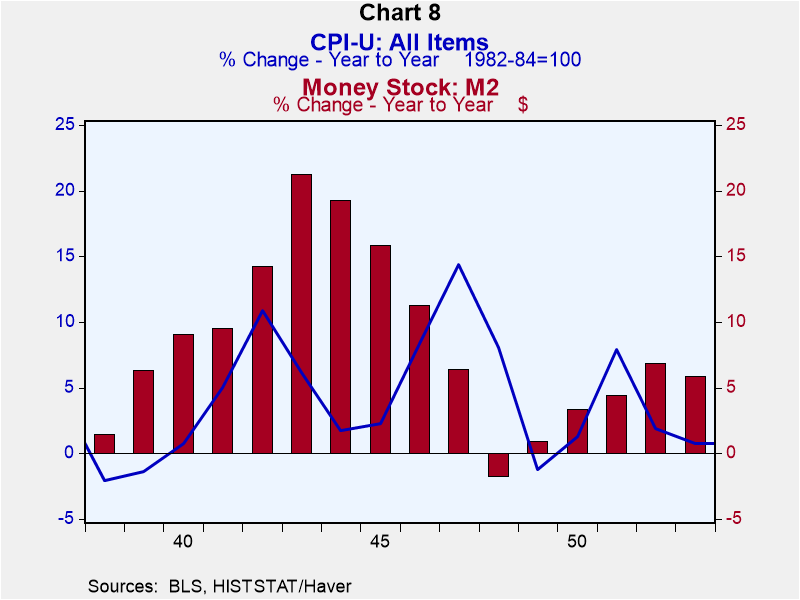
When WWII broke out, the Fed entered into an agreement with the Treasury to peg the yields on Treasury bills and bonds. The Fed pledged to keep the interest rate on 3-month Treasury bills from rising above 3/8% and the yield on Treasury bonds from rising above 2-1/2%. Around midyear 1947, the Fed stopped pegging the rate on Treasury bills. In March 1951, the Fed reached an "accord" with the Treasury to stop pegging the yield on Treasury bonds. Pegging the yields of Treasury securities at low levels helped restrain the cost of servicing the massive amount of debt outstanding. But it also required the Fed to purchase large amounts of securities in order to enforce the interest-rate pegs. This manifested itself in rapid growth in the money supply. All of this is shown in Chart 7. The rapid growth in the money supply during WWII under normal circumstances would have resulted in high inflation. But from early 1942 through the spring of 1946, the federal government imposed controls on prices. But, as shown in Chart 8, after the lifting of price controls in the spring of 1946, the prior rapid growth in the money supply resulted in a sharp increase in consumer-price inflation in 1947.
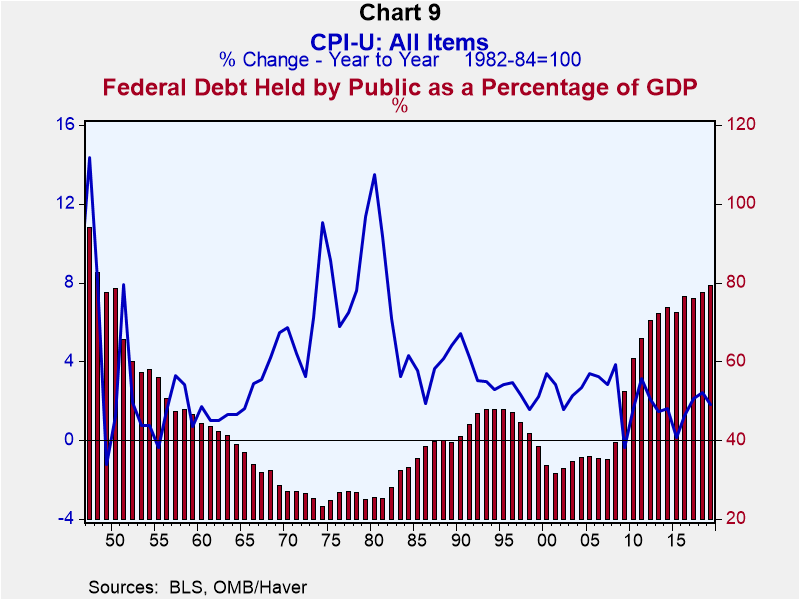
Speaking of inflation, that is another method to bring down the federal debt-to- nominal GDP ratio. It sure worked wonders during the 1970s and early 1980s in bringing down the federal debt-to-nominal GDP ratio, as shown in Chart 9. If the central bank creates higher inflation, this boosts nominal GDP. Thus, for a given amount of federal debt outstanding, the ratio of debt to GDP falls. But won't higher inflation increase interest rates because of the expected-inflation premium? And won't that result in an increase in debt issuance due to the higher debt-servicing costs? Higher inflation will raise those interest rates on maturities of securities the central bank is not pegging. For example, if the central bank is pegging interest rates on short-maturity securities, then interest rates on longer-maturity interest rates will rise in reaction to the higher inflation. The government need not incur higher debt-servicing costs if it refunds maturing debt and issues new debt in the short-maturity range. Alternatively, the central bank could peg interest rates at the long end of the maturity spectrum. Then the government would finance maturing and issue new debt at the long end of the maturity curve.
I don't know how the Treasury is going try to prevent the national debt-to-GDP ratio from exploding ever upward once the COVID-19 epidemic is over and the economy is in a strong recovery phase. Perhaps there the body politic will accept some tax increases. But there was no appetite for that before COVID-19. Certainly the COVID-induced safety-net spending will be cut. But the primary drivers of post-COVID spending will be Social Security and Medicare. Do you think we Baby Boomers will vote for that? Perhaps COVID will take enough of us Baby Boomers out so there will be a reduced supply of Social Security and Medicare beneficiaries, but don't bet on it. That leaves us with inflation, the silent tax, coming on the heels of the silent COVID-19 "enemy". In the past 20 years, the median percent change in the annual average CPI (all items) has been 2.2%. My bet is it will be higher than 2.2% over the next 20 years? My bet also is that the level of interest rates, other than the maturity sector the Fed pegs, will be higher than what we have become accustomed to in recent years. Equities might have some competition.
Viewpoint commentaries are the opinions of the author and do not reflect the views of Haver Analytics.Paul L. Kasriel
AuthorMore in Author Profile »Mr. Kasriel is founder of Econtrarian, LLC, an economic-analysis consulting firm. Paul’s economic commentaries can be read on his blog, The Econtrarian. After 25 years of employment at The Northern Trust Company of Chicago, Paul retired from the chief economist position at the end of April 2012. Prior to joining The Northern Trust Company in August 1986, Paul was on the official staff of the Federal Reserve Bank of Chicago in the economic research department. Paul is a recipient of the annual Lawrence R. Klein award for the most accurate economic forecast over a four-year period among the approximately 50 participants in the Blue Chip Economic Indicators forecast survey. In January 2009, both The Wall Street Journal and Forbes cited Paul as one of the few economists who identified early on the formation of the housing bubble and the economic and financial market havoc that would ensue after the bubble inevitably burst. Under Paul’s leadership, The Northern Trust’s economic website was ranked in the top ten “most interesting” by The Wall Street Journal. Paul is the co-author of a book entitled Seven Indicators That Move Markets (McGraw-Hill, 2002). Paul resides on the beautiful peninsula of Door County, Wisconsin where he sails his salty 1967 Pearson Commander 26, sings in a community choir and struggles to learn how to play the bass guitar (actually the bass ukulele). Paul can be contacted by email at econtrarian@gmail.com or by telephone at 1-920-559-0375.
More Economy in Brief
 Global| Feb 05 2026
Charts of the Week: Balanced Policy, Resilient Data and AI Narratives
by:Andrew Cates


