 Global| Apr 06 2007
Payrolls Gain 180,000, Unemployment Eases to 4.4%; New Data on All-Employee Earnings
Summary
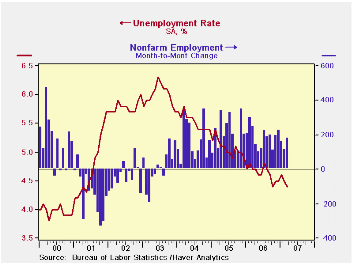
Nonfarm payrolls grew by 180,000, beating out forecasts around 130,000; the prior two months' gains were revised upward once again, this time by a collective 32,000. See the third paragraph for more on these revisions. The [...]

Nonfarm payrolls grew by 180,000, beating out forecasts around 130,000; the prior two months' gains were revised upward once again, this time by a collective 32,000. See the third paragraph for more on these revisions.
The unemployment rate eased last month to 4.4% from 4.5% in February. This decrease was a "legitimate" one, coming because the number of people employed, according to the household survey, grew (335,000) and the number unemployed went down (141,000). The decline in February's unemployment rate, by contrast, had occurred from a decrease in labor force participation and accompanied a decline in employment as well as in unemployment. Over the past two months, unemployment has fallen by 293,000.
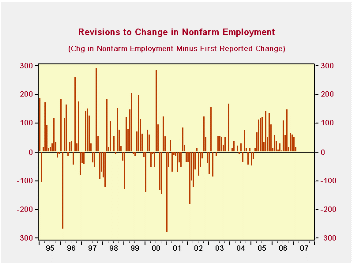
Returning to the establishment data, we noticed repeated remarks in these commentaries about "upward revisions to the prior months". So we looked more closely. Indeed, there have been eventual upward revisions to the first report continuously since March 2005, as is evident in the second graph. Compared with the initial report, the most current figures have been altered by the subsequent two monthly reports and each year's re-benchmarking and seasonal factor updating. There's clearly a developing bias since early 2003 which contrasts with up-and-down spikes in earlier years, even back well before the chart begins. Late reporting companies in recent years are the growing ones, evidently. BLS documentation shows that about two-thirds of the sample report in time for the initial estimate, rising to roughly 85% in the subsequent two months. Note that the figures for the initial report come from Haver's AS1REPNA database, compiled in conjunction with the forecast survey consensus data from Action Economics.
Regarding the details of the jobs figures, we were right a month ago in our assessment that February's cold weather had hurt the construction sector. It rebounded by 57,000 after that month's 61,000 drop. This is an impressive move, since seasonal factor shifts in these two months act to moderate declines in February and increases in March. Other industries contributing to March's overall advance include retail trade, especially supermarkets and "general merchandise" stores. Accommodation and food services, particularly the latter, also gained, along with a variety of health care sectors. Government employment rose 23,000, nearly all at the state and local level.
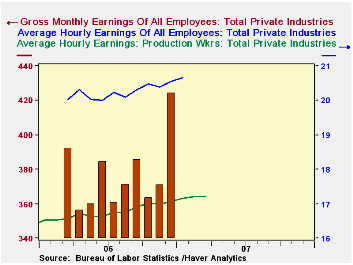
Separately, the BLS released new "experimental" series on hours and earnings for all employees, not just so-called production workers. These data are available today (April 6, 2007) for March 2006 through January 2007. As seen in the third graph, these earnings run about $3.50/hour more than the production worker series. There aren't enough data for seasonal adjustment; this will occur after three full years of data are available. More interesting perhaps is the new series titled "gross monthly earnings". This includes cash wages plus extra monetary payments such as bonuses, lump-sums and exercised stock options. These data are intended to cover the entire month, not just the traditional "reference week", and are presently available from March 2006 through December 2006. The payment of "Christmas" or year-end bonuses is readily apparent in the December figure. Industry breakdowns for all of these series have now been added to USECON, under a menu item titled "Experimental" in the Employment and Earnings heading. They will also be available in the LABOR database.
| Employment | March | February | January | Y/Y | 2006 | 2005 | 2004 |
|---|---|---|---|---|---|---|---|
| Nonfarm Payrolls | 180,000 | 113,000 | 162,000 | 1.5% | 1.8% | 1.7% | 1.1% |
| Manufacturing | -16,000 | -11,000 | -1,000 | -0.7% | -0.2% | -0.6% | -1.3% |
| Average Weekly Hours | 33.9 | 33.8 | 33.8 | 33.8 (Mar. '06) | 33.9 | 33.8 | 33.7 |
| Average Hourly Earnings | 0.3% | 0.4% | 0.2% | 4.1% | 3.9% | 2.8% | 2.1% |
| Unemployment Rate | 4.4% | 4.5% | 4.6% | 4.7% (Mar. '06) | 4.6% | 5.1% | 5.5% |
Carol Stone, CBE
AuthorMore in Author Profile »Carol Stone, CBE came to Haver Analytics in 2003 following more than 35 years as a financial market economist at major Wall Street financial institutions, most especially Merrill Lynch and Nomura Securities. She had broad experience in analysis and forecasting of flow-of-funds accounts, the federal budget and Federal Reserve operations. At Nomura Securities, among other duties, she developed various indicator forecasting tools and edited a daily global publication produced in London and New York for readers in Tokyo. At Haver Analytics, Carol was a member of the Research Department, aiding database managers with research and documentation efforts, as well as posting commentary on select economic reports. In addition, she conducted Ways-of-the-World, a blog on economic issues for an Episcopal-Church-affiliated website, The Geranium Farm. During her career, Carol served as an officer of the Money Marketeers and the Downtown Economists Club. She had a PhD from NYU's Stern School of Business. She lived in Brooklyn, New York, and had a weekend home on Long Island.
More Economy in Brief
 Global| Feb 05 2026
Charts of the Week: Balanced Policy, Resilient Data and AI Narratives
by:Andrew Cates


