 Global| Mar 09 2007
Payrolls Up 97,000, Close to Forecast; Construction Hit by Bad Weather
Summary
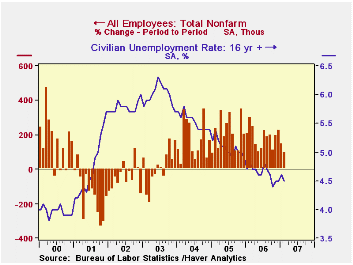
Nonfarm payrolls grew by 97,000, an increase that was right in line with the Consensus forecast for a 100,000 rise; the prior two months' gains were revised upward once again, this time by a collective 55,000. The unemployment rate [...]

Nonfarm payrolls grew by 97,000, an increase that was right in line with the Consensus forecast for a 100,000 rise; the prior two months' gains were revised upward once again, this time by a collective 55,000.
The unemployment rate eased last month to 4.5% from 4.6%, but this was the result of a decline in the total labor force of 190,000. Household employment edged lower by 38,000 and the number unemployed fell 152,000. The labor force participation rate fell to 66.2% from 66.3% in January and the employment rate (the number of people employed as a share of the civilian population over age 16) decreased to 63.2% in February from 63.3% the month before.
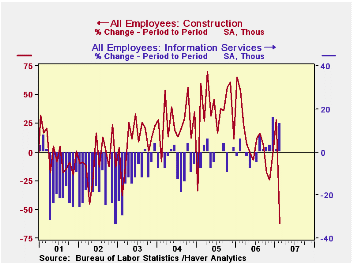
From the establishment survey, the job gain of 97,000 was the smallest since January 2005. However, the February figure included a 62,000 drop in construction jobs, most probably related to the severe winter storms that hit several parts of the country during the reference week. Other data from the household survey show that "bad weather" caused 522,000 employees to be "not at work", the largest number since January 1997. [This information is in Haver's EMPL database.] 
Total private sector payrolls grew 58,000 (incorporating that construction drop), close to the ADP figure of 57,000 reported Wednesday. Manufacturing jobs continue to decline, falling 14,000, the eighth consecutive negative number; the two most recent declines were revised noticeably, however, to just 14,000 combined from 34,000 reported last month. Private service sector jobs picked up to a 129,000 increase and were revised for January from 90,000 to 105,000. Most notable is a small but so far sustained recovery in the information sector, up 13,000 in February, following increases of 1,000 and 16,000 in January and December. This is the best result for that grouping since the tech bust in 2000. Financial services and business and professional services are seeing modest slowdowns, but retail trade looks to have stabilized in January and February after a six-month-long contraction from July through December. Government employment was up 39,000 in February, the largest increase since last September.
Average hourly earnings increased 0.4%, offsetting the prior month's weak 0.2% rise. The average workweek, though, dipped to 33.7 hours, a second consecutive 0.1 hour decrease.
| Employment | February | January | December | Y/Y | 2006 | 2005 | 2004 |
|---|---|---|---|---|---|---|---|
| Nonfarm Payrolls | 97,000 | 146,000 | 226,000 | 1.5% | 1.8% | 1.7% | 1.1% |
| Manufacturing | -14,000 | -2,000 | -12,000 | -0.7% | -0.2% | -0.6% | -1.3% |
| Average Weekly Hours | 33.7 | 33.8 | 33.9 | 33.8 (Feb. '06) | 33.8 | 33.8 | 33.7 |
| Average Hourly Earnings | 0.4% | 0.2% | 0.5% | 4.1% | 3.9% | 2.8% | 2.1% |
| Unemployment Rate | 4.5% | 4.6% | 4.5% | 4.8% (Feb. '06) | 4.6% | 5.1% | 5.5% |
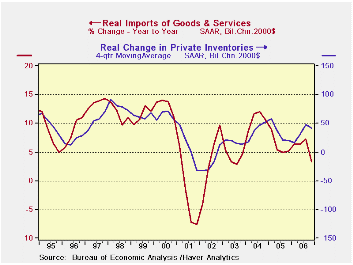
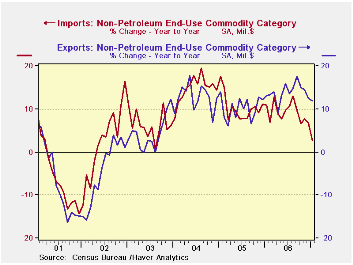
 The US goods and services deficit dropped in January 2007 to $59.1 billion from a revised $61.5 billion in December. January exports were $1.4 billion more than December exports of $125.3 billion. January imports were $1.0 billion less than December imports of $186.7 billion. US non-oil trade also improved sharply in January by nearly $3.5 billion. The improvement on the overall balance of trade for December over the Q4 average of -$59.5 billion imparts a slight upward push (about 0.2 percentage points) to GDP in the first quarter of 2007. While that is a good start it is a push that may not last. Imports are being inordinately restrained by a domestic slow down in growth coupled with an inventory-paring cycle. At the same time foreign growth seem to be in a holding pattern – if that - rather than accelerating. The US goods and services deficit dropped in January 2007 to $59.1 billion from a revised $61.5 billion in December. January exports were $1.4 billion more than December exports of $125.3 billion. January imports were $1.0 billion less than December imports of $186.7 billion. US non-oil trade also improved sharply in January by nearly $3.5 billion. The improvement on the overall balance of trade for December over the Q4 average of -$59.5 billion imparts a slight upward push (about 0.2 percentage points) to GDP in the first quarter of 2007. While that is a good start it is a push that may not last. Imports are being inordinately restrained by a domestic slow down in growth coupled with an inventory-paring cycle. At the same time foreign growth seem to be in a holding pattern – if that - rather than accelerating. Inventory-cutting accounts for much of the import weakness The chart on the left shows the relationship between changes in imports (in %) and changes in inventories (Real $billions). Inventory swings account for a good deal of the action for changes in imports and it is happening again in late 2006 (these are quarterly GDP sourced data). When (if?) the economy recovers further in 2007 as demand becomes steadier and inventory-cutting stops, we can expect imports to go back to their normal behavior, that is, inflation-adjusted imports growing at about twice the speed (or more) of US real GDP. At that point adjustment in the US trade deficit will become difficult.  Non-oil trade trends and facts Non-oil trade trends and factsThe current trade trends are clear. Exports are outpacing imports and have done so for most of 2006 (see the non petroleum export and import chart). Stronger foreign growth that has boosted US exports has had something to do with this and so has the US inventory cycle. Since non-oil imports are nearly 50% larger in nominal terms that non-oil exports, exports must grow about 50% faster just to hold the line on the nominal trade balance for these accounts. That seems a challenge that is just to stiff for the period ahead despite past success. Since early 2005, export and import growth on this basis have been roughly equal, with export growth having an edge recently as the US economy slowed. But as the economy strengthens the import link to US growth will revive. Real export growth at 7.6% currently would show only a small margin of improvement compared to import growth at 6% and a loss compared to growth at 8.7%. (US real imports will grow by twice US growth given the habitually high US import elasticity of 2 to 2.5; US growth is expected in the range of 3% to 3.5% for the year ahead). And these figures exclude oil trade which likely will act to push the overall deficit even higher or blunt improvement in non-oil trade should that occur. Tipping point? The US may already be at a tipping point for the size of its current account deficit, the better part of that being made up by its trade deficit. The US current account deficit is at 6.8% of GDP in Q3 2006. For developing economies 5% of GDP is thought to be the point where lending bankers get nervous. China has already run its total foreign exchange reserves up to over one trillion dollars equivalent. Over the last four quarters the US current account deficit has racked up a total of $878 billion. That’s 88% of a trillion right there. Who will absorb the new trillion dollars that deficit is pumping out? Who wants new US liabilities at a pace fast approaching one trillion dollars per year? Systemic risk? It should be lost on no one that the stock market turbulence of early March featured Japan and China. China’s nascent and tiny stock market’s fall was the proximate cause of the market volatility. But Japan’s yen-carry trade also figured prominently in the discussion. There can be no doubt that the massive size of the trade and capital flow disequilibrium in Japan, China and the US is partly to blame for such events and last week serves as a warning for the future. These imbalances must be addressed rather than be allowed to grow further in the wrong directions. The January trade report The January trade report leaves exports in a broad-based slowdown over three months. Real exports’ three month growth (annualized) is below the annual pace over six-months and 12-months. And that slowdown is present for four of six end-use categories of exports: foods, feed & beverages, industrial supplies & materials, capital goods, and the catch all category of miscellaneous goods for the 3-month to 6-month comparison. For imports the pick up has not yet begun as industrial supplies and materials alone are growing strongly and that is oil-related. Only imports of capital goods and auto parts imports are stronger over three and six months. In those cases foreign-made autos are giving US production some stiff competition and the strength in capital goods imports belies the weakness in orders for capital goods and the weak spending for capital improvements by business that we have seen early in 2007. Strength in capital goods import is an oddity. To sum up, the trade picture remains murky. The month’s result for January has turned up and moved the deficit lower, but intermediate trends show deterioration. The year-over-year growth rates are linked to macroeconomic phenomena that are shifting and that have yet to show their impact. |
Carol Stone, CBE
AuthorMore in Author Profile »Carol Stone, CBE came to Haver Analytics in 2003 following more than 35 years as a financial market economist at major Wall Street financial institutions, most especially Merrill Lynch and Nomura Securities. She had broad experience in analysis and forecasting of flow-of-funds accounts, the federal budget and Federal Reserve operations. At Nomura Securities, among other duties, she developed various indicator forecasting tools and edited a daily global publication produced in London and New York for readers in Tokyo. At Haver Analytics, Carol was a member of the Research Department, aiding database managers with research and documentation efforts, as well as posting commentary on select economic reports. In addition, she conducted Ways-of-the-World, a blog on economic issues for an Episcopal-Church-affiliated website, The Geranium Farm. During her career, Carol served as an officer of the Money Marketeers and the Downtown Economists Club. She had a PhD from NYU's Stern School of Business. She lived in Brooklyn, New York, and had a weekend home on Long Island.
More Economy in Brief
 Global| Feb 05 2026
Charts of the Week: Balanced Policy, Resilient Data and AI Narratives
by:Andrew Cates


