 Global| Dec 23 2002
Personal Income Moderate, Spending Firm
by:Tom Moeller
|in:Economy in Brief
Summary
Personal income (4.3% AR, YTD) rose slightly more than expected last month. It was the fourth consecutive 0.3% monthly gain in income. Growth in wage and salary disbursements has been relatively firm recently, up 0.4% last month and [...]

Personal income (4.3% AR, YTD) rose slightly more than expected last month. It was the fourth consecutive 0.3% monthly gain in income.
Growth in wage and salary disbursements has been relatively firm recently, up 0.4% last month and between 0.3% and 0.6% during the last four months (3.4% AR, YTD). Personal transfer payments rose 0.3% after having been unchanged in October (8.7% YTD, AR). Personal interest income fell for the fifth straight month (0.2% YTD, AR).
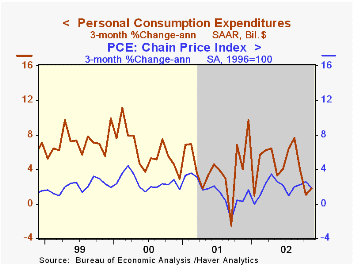
Personal consumption expenditures (4.7% YTD, AR) rose slightly more than expected and in 4Q are 1.8% (AR) above the 3Q average. Durable goods purchases rose 1.5% following sharp declines the prior two months. Unit sales of light vehicles recovered some in November to a 15.94 mil. rate. Spending on nondurable goods rose 0.4% after a sharp 0.8% October gain. Spending on services rose 0.4% (5.4% YTD, AR).
Disposable personal income rose 0.4% (8.2% YTD, AR) for the fourth consecutive month. Personal tax payments rose a slight 0.1% but are down sharply for the year.
The PCE price deflator rose 0.1%, slightly below the 0.2% gains of the prior three months. Prices were up 2.1% (YTD, AR). Less food and energy, the price deflator rose just 0.1% (1.7% YTD, AR).
| Disposition of Personal Income | Nov | Oct | Y/Y | 2001 | 2000 | 1999 |
|---|---|---|---|---|---|---|
| Personal Income | 0.3% | 0.3% | 4.5% | 3.3% | 8.0% | 4.9% |
| Personal Consumption | 0.5% | 0.4% | 4.6% | 4.5% | 7.0% | 6.7% |
| Savings Rate | 4.3% | 4.4% | 0.9% | 2.3% | 2.8% | 2.7% |
| PCE Price Deflator | 0.1% | 0.2% | 1.8% | 2.0% | 2.5% | 1.6% |
by Tom Moeller December 23, 2002

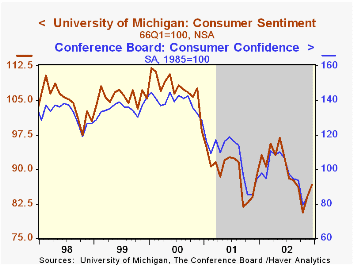
The Index of Consumer Sentiment from the University of Michigan for the full month of December was slightly lower than Consensus expectations. Nevertheless, sentiment rose 3.0% m/m and has has risen 7.6% during the last two months.
Indexes of current conditions and expectations both rose.
The University of Michigan survey is not seasonally adjusted.
During the last ten years there has been an 84% correlation between changes in Consumer Sentiment and Consumer Confidence published by the Conference Board.
For a study of consumer sentiment by the NY Federal Reserve click here
For a more technical analysis by the NY Fed of Consumer Sentiment, go here
| University of Michigan | Dec | Nov | Y/Y | 2001 | 2000 | 1999 |
|---|---|---|---|---|---|---|
| Consumer Sentiment | 86.7 | 84.2 | -2.4% | 89.2 | 107.6 | 105.8 |
Tom Moeller
AuthorMore in Author Profile »Prior to joining Haver Analytics in 2000, Mr. Moeller worked as the Economist at Chancellor Capital Management from 1985 to 1999. There, he developed comprehensive economic forecasts and interpreted economic data for equity and fixed income portfolio managers. Also at Chancellor, Mr. Moeller worked as an equity analyst and was responsible for researching and rating companies in the economically sensitive automobile and housing industries for investment in Chancellor’s equity portfolio. Prior to joining Chancellor, Mr. Moeller was an Economist at Citibank from 1979 to 1984. He also analyzed pricing behavior in the metals industry for the Council on Wage and Price Stability in Washington, D.C. In 1999, Mr. Moeller received the award for most accurate forecast from the Forecasters' Club of New York. From 1990 to 1992 he was President of the New York Association for Business Economists. Mr. Moeller earned an M.B.A. in Finance from Fordham University, where he graduated in 1987. He holds a Bachelor of Arts in Economics from George Washington University.
More Economy in Brief
 Global| Feb 05 2026
Charts of the Week: Balanced Policy, Resilient Data and AI Narratives
by:Andrew Cates


