 Global| Aug 18 2005
Philadelphia Fed Index Improved Further
by:Tom Moeller
|in:Economy in Brief
Summary
The Index of General Business Conditions in the manufacturing sector in August from the Philadelphia Fed added to the prior month's gain and rose to 17.5, the highest level since April. Consensus expectations had been for a lesser [...]
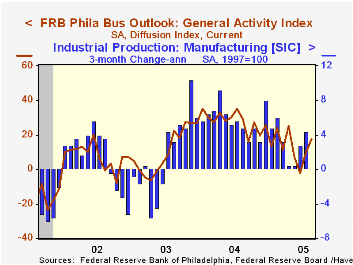
The Index of General Business Conditions in the manufacturing sector in August from the Philadelphia Fed added to the prior month's gain and rose to 17.5, the highest level since April. Consensus expectations had been for a lesser improvement to 14.0.
During the last ten years there has been a 68% correlation between the level of the Philadelphia Fed Business Conditions Index and three month growth in factory sector industrial production. There has been a 50% correlation with q/q growth in real GDP.
The sub indexes measuring new orders and shipments led with gains to the highest levels since April. The index covering the number of employees also rose. During the last ten years there has been a 64% correlation between the employment index and the three month growth in factory payrolls.
The business conditions index reflects a separate survey question, not the sub indexes.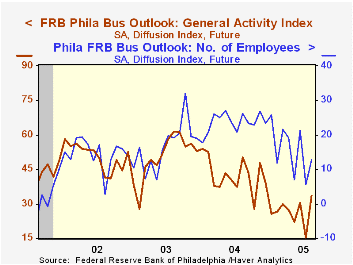
The separate index of expected business conditions in six months jumped to its best level this year led by expectations of increased hiring.
The prices paid index slipped and gave back a piece of the moderate improvement in July. During the last ten years there has been a 75% correlation between the prices paid index and the three month growth in the intermediate goods PPI. The correlation with the finished goods PPI has been 50% and with the CPI it's been 43%.
The Philadelphia Fed index is based on a survey of 250 regional manufacturing firms, but these firms sell nationally and internationally.
The latest Business Outlook survey from the Philadelphia Federal Reserve Bank can be found here.
| Philadelphia Fed Business Outlook | Aug | July | Aug '04 | 2004 | 2003 | 2002 |
|---|---|---|---|---|---|---|
| General Activity Index | 17.5 | 9.6 | 29.2 | 28.1 | 10.6 | 7.7 |
| Prices Paid Index | 25.9 | 26.5 | 54.3 | 51.3 | 16.8 | 12.3 |
by Tom Moeller August 17, 2005
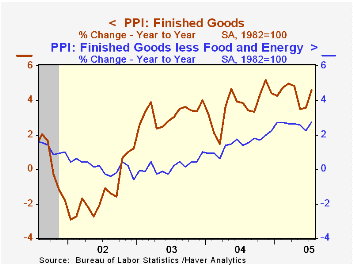
In July a 1.0% rise in the producer price index for finished goods was double Consensus expectations for a 0.5% increase, though it followed no change in prices one month earlier.
Also double Consensus expectations was the 0.4% gain in prices excluding food & energy prices which followed a slight decline in June.
The surprise stemmed mostly from a 1.5% increase in passenger car prices versus the 1.0% decline tallied by the survey of consumer prices. The gain lifted core finished consumer good prices 0.4% (+2.9% y/y). Consumer durable goods prices increased 0.6% (1.6% y/y) and core consumer nondurable goods prices rose 0.2% (3.8% y/y).
Capital goods prices also rose a strong 0.5% (2.6% y/y) due to a 1.4% (-1.8% y/y) jump in light truck prices as well as a 1.0% (6.1% y/y) surge in civilian aircraft.
Finished energy prices doubled the prior month's increase and rose 4.4% (15.2% y/y) lifted by a 10.9% (29.6% y/y) surge in gasoline prices, a 3.7% (11.1% y/y) increase in natural gas and a 5.1% (58.6% y/y) spike in home heating oil.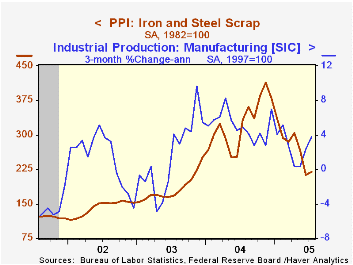
Intermediate goods prices also rose a strong 1.0% due to strength in energy prices, up 5.2%. Core intermediate goods prices, however, declined for the third consecutive month. The 0.1% decline in July was led by lower prices for containers and durable manufacturing materials which fell for the fifth consecutive month.
Crude prices reflected the strength in energy prices, up 12.8%, and rose 6.7%. Core crude prices also were strong following two months of sharp decline. Iron & steel scrap prices rose 2.7% (-34.2% y/y) but they are down 46.8% from the peak last November. During the last thirty years "core" crude prices have been a fair indicator of industrial sector activity with a 48% correlation between the six month change in core crude prices and the change in factory sector industrial production.
The Monetary Policy Transmission Mechanism? from the Federal Reserve Bank of St. Louis is available here.
| Producer Price Index | July | June | Y/Y | 2004 | 2003 | 2002 |
|---|---|---|---|---|---|---|
| Finished Goods | 1.0% | 0.0% | 4.6% | 3.6% | 3.2% | -1.3% |
| Core | 0.4% | -0.1% | 2.8% | 1.5% | 0.2% | 0.1% |
| Intermediate Goods | 1.0% | 0.1% | 6.5% | 6.6% | 4.6% | -1.5% |
| Core | -0.1% | -0.2% | 4.3% | 5.7% | 2.0% | -0.5% |
| Crude Goods | 6.7% | -3.3% | 8.5% | 17.5% | 25.1% | -10.6% |
| Core | 3.1% | -4.3% | -2.2% | 26.6% | 12.4% | 3.8% |
by Tom Moeller August 17, 2005
Total mortgage applications rose last week for the first time following three consecutive weeks of decline according to the Mortgage Bankers Association. The 2.2% w/w increase nevertheless left applications in August 4.7% below July which fell 1.4% from June.
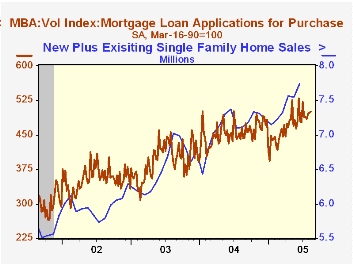
Purchase applications ticked up 0.1% last week and in August are 0.7% above the July average which rose 0.9% versus June. During the last ten years there has been a 49% correlation between the y/y change in purchase applications and the change in new plus existing single family home sales. Mortgage applications to refinance recovered 5.0% w/w following several weeks of sharp decline.
The effective interest rate on a conventional 30-year mortgage backpedaled to 6.03% from 6.16% the prior week. The effective rate on a 15-year mortgage also fell to 5.72%.
The Mortgage Bankers Association surveys between 20 to 35 of the top lenders in the U.S. housing industry to derive its refinance, purchase and market indexes. The weekly survey accounts for more than 40% of all applications processed each week by mortgage lenders. Visit the Mortgage Bankers Association site here.
Monetary Policy and Asset Price Bubbles from the Federal Reserve Bank of San Francisco is available here.
| MBA Mortgage Applications (3/16/90=100) | 08/12/05 | 08/05/05 | Y/Y | 2004 | 2003 | 2002 |
|---|---|---|---|---|---|---|
| Total Market Index | 761.3 | 745.0 | 10.4% | 735.1 | 1,067.9 | 799.7 |
| Purchase | 499.3 | 498.8 | 6.9% | 454.5 | 395.1 | 354.7 |
| Refinancing | 2,285.5 | 2,176.5 | 15.3% | 2,366.8 | 4,981.8 | 3,388.0 |
by Carol Stone August 17, 2005
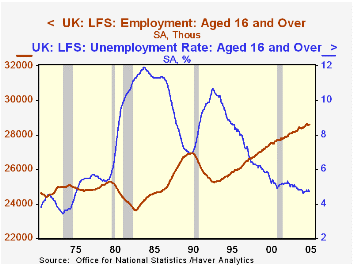
UK labor markets have moved little in the last few months. We last wrote about the Labor Force Survey in April, covering the February information. The unemployment rate then was 4.7% and it has remained at that level or at 4.8% through May. Employment has also held within a tight range: it reached a peak of 28.64 million in January, and has lost 5,000 on net in the succeeding four months; most recently, it gained 25,000 from the April data to May. All of these figures are centered 3-month moving averages, so this specific report released today by the Office of National Statistics (ONS) covers April, May and June, that is, the second quarter.
Press reports and the ONS itself prefer to emphasize these comparisons with three months ago. Over that time span, despite the flat unemployment rate, the number unemployed rose 27,000 and the number of people employed fell 16,000, a weaker-than-desirable performance. Additionally, the number of people claiming jobless benefits, the so-called claimant count, has increased; 866,000 people filed for benefits in July (a figure for the single month, not a multi-period average), a sixth consecutive increase totaling about 52,000. As seen in the second graph, such upturns are not frequent, although those associated with business cycles have generally been more pointed with an abrupt steep rise. So while this current modest rise is not encouraging, neither is it a clear sign of a negative direction for the UK economy. 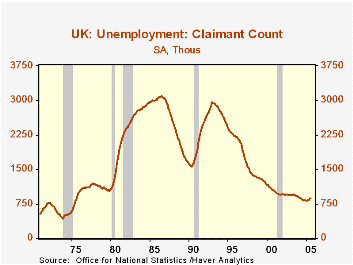
A Bank of England action earlier this month reflected the same kind of ambivalence. On August 4, the Bank reduced its repo rate from 4.75% to 4.50%; the minutes of that monetary policy meeting, which were published today, reveal that the vote was 5 to 4, with the Bank's Governor, Mervyn King, in the dissenting minority. This is the first time that the head of the Bank was on the short end of such a policy vote since the BoE became independent of the UK Treasury in 1997. In the United States, this has probably not ever happened, with just one near-miss to our recollection, during the Paul Volcker era in the early 1980s. Mr. King was concerned about inflation more than unemployment, and in fact, the consumer price data for July, issued yesterday, show a similar picture to that in the United States. Total CPI for the UK was up 2.3% year-on-year through July, but the index excluding energy is up "just" 1.9%. [US price numbers, recall, were up 0.5% in the month, but only just over 0.1% excluding food and energy.] The UK core inflation rate itself is increasing. It is not hard to see that the BoE governor and officers might have anticipated such an unpleasant combination as higher inflation and a stalling labor market and so moved very gingerly to alter their policy position.
| UK Labor Force Survey All seasonally adjusted |
July 2005 | June 2005 | May 2005 | Apr 2005 | 2004 | 2003 | 2002 |
|---|---|---|---|---|---|---|---|
| Unemployment Rate (%) | 4.7* | 4.8* | 4.7 | 5.0 | 5.2 | ||
| Claimant Count (thous) | 866 | 863 | 856 | 842 | 854 | 933 | 947 |
| Employment (mil) | 28.59* | 28.57* | 28.44 | 28.18 | 27.91 | ||
| Change (thous) | +25K | -11K | +0.9% | +0.9% | +0.8% | ||
| Average Earnings Index Incl Bonuses: "Headline Rate"(%)** | 4.2 | 4.1 | 4.6 | 4.4 | 3.4 | 3.5 | |
| Average Earnings Index Ex Bonuses: "Headline Rate" (%)** | 4.0 | 4.0 | 4.1 | 4.2 | 3.6 | 4.0 |
Tom Moeller
AuthorMore in Author Profile »Prior to joining Haver Analytics in 2000, Mr. Moeller worked as the Economist at Chancellor Capital Management from 1985 to 1999. There, he developed comprehensive economic forecasts and interpreted economic data for equity and fixed income portfolio managers. Also at Chancellor, Mr. Moeller worked as an equity analyst and was responsible for researching and rating companies in the economically sensitive automobile and housing industries for investment in Chancellor’s equity portfolio. Prior to joining Chancellor, Mr. Moeller was an Economist at Citibank from 1979 to 1984. He also analyzed pricing behavior in the metals industry for the Council on Wage and Price Stability in Washington, D.C. In 1999, Mr. Moeller received the award for most accurate forecast from the Forecasters' Club of New York. From 1990 to 1992 he was President of the New York Association for Business Economists. Mr. Moeller earned an M.B.A. in Finance from Fordham University, where he graduated in 1987. He holds a Bachelor of Arts in Economics from George Washington University.
More Economy in Brief
 Global| Feb 05 2026
Charts of the Week: Balanced Policy, Resilient Data and AI Narratives
by:Andrew Cates


