 Global| Apr 19 2005
PPI Again Boosted by Petroleum
by:Tom Moeller
|in:Economy in Brief
Summary
The Producer Price Index for finished goods rose 0.7% in March, the largest one month rise since November and surpassed Consensus expectations for a 0.6% gain. Excluding food & energy prices, however, the PPI rose 0.1% for the second [...]
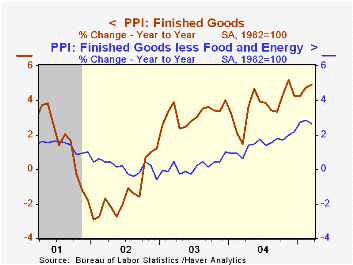
The Producer Price Index for finished goods rose 0.7% in March, the largest one month rise since November and surpassed Consensus expectations for a 0.6% gain. Excluding food & energy prices, however, the PPI rose 0.1% for the second consecutive month. Consensus expectations had been for a 0.2% increase.
Finished energy prices advanced 3.3% (15.3% y/y) as gasoline prices jumped 12.3% (31.9% y/y) and fuel oil prices rose 16.1% (55.8% y/y). In April, prices for crude petroleum and for refined petroleum products are down versus March.
Core finished consumer goods prices rose 0.1% (2.6% y/y). Consumer durable goods prices fell by 0.1% (1.6% y/y) for the second consecutive monthly decline. Passenger cars fell again (+1.1% y/y) and home electronic equipment prices were off 0.2% (-4.0% y/y). Household appliance prices rose 0.3% (1.8% y/y).
Core consumer nondurable goods prices rose 0.1% (3.3% y/y) and capital goods prices increased 0.3% (+2.7% y/y). Finished food prices rose 0.3% (3.8% y/y).
Intermediate goods prices posted the largest increase since October. The 1.0% advance reflected a 3.7% (16.7% y/y) gain in energy prices. Core intermediate prices rose 0.3% though plywood prices fell (-13.9% y/y) as did hardwood lumber prices (-0.8% y/y).
Crude prices jumped 4.3% on the strength of surging oil prices, up 5.5% (28.4% y/y). Core crude prices rose for the first month in four. The 1.0% increase reflected price jumps for copper (15.9% y/y) & aluminum (8.9% y/y) base scrap. During the last thirty years "core" crude prices have been a fair indicator of industrial sector activity with a 48% correlation between the six month change in core crude prices and the change in factory sector industrial production.
Inflation Targeting under Commitment and Discretion from the Federal Reserve Bank of San Francisco is available here.
| Producer Price Index | Mar | Feb | Y/Y | 2004 | 2003 | 2002 |
|---|---|---|---|---|---|---|
| Finished Goods | 0.7% | 0.4% | 4.9% | 3.6% | 3.2% | -1.3% |
| Core | 0.1% | 0.1% | 2.6% | 1.5% | 0.2% | 0.1% |
| Intermediate Goods | 1.0% | 0.7% | 8.4% | 6.6% | 4.6% | -1.5% |
| Core | 0.3% | 0.5% | 7.6% | 5.7% | 2.0% | -0.5% |
| Crude Goods | 4.3% | -1.6% | 10.8% | 17.6% | 25.1% | -10.6% |
| Core | 1.0% | -3.0% | 3.4% | 26.5% | 12.4% | 3.8% |
by Tom Moeller April 19, 2005
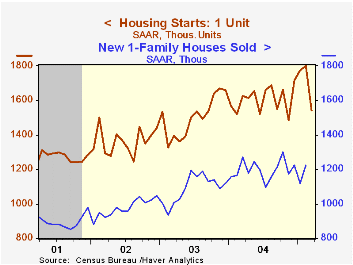
Housing starts fell a sharp 17.6% from the record high the prior month which was revised slightly higher from the initial report. March starts of 1.837M were the lowest since November of last year.Consensus expectations had been for a lesser decline to 2.10M starts.
Single-family starts of 1.54M slid 14.4% m/m from the upwardly revised record high in February. Single family starts in the Northeast dropped 19.9% (-16.9% y/y) while single family starts in the Midwest reversed all of the prior month's jump with a 18.5% (-8.5% y/y) slump. Single family starts in the South fell 15.3% (-4.8% y/y) and starts in the West were off 7.8% (+0.2% y/y).
Multi family starts cratered by nearly a third to the lowest level since June of last year.
Building permits fell 4.0% but the decline the prior month was revised shallower.
| Housing Starts (000s, AR) | Mar | Feb | Y/Y | 2004 | 2003 | 2002 |
|---|---|---|---|---|---|---|
| Total | 1,837 | 2,229 | -8.2% | 1,952 | 1,853 | 1,7 10 |
| Single-family | 1,539 | 1,798 | -5.2% | 1,605 | 1,505 | 1,363 |
| Multi-family | 298 | 431 | -20.7% | 347 | 348 | 347 |
| Building Permits | 2,023 | 2,107 | 0.2% | 2,035 | 1,8 89 | 1,749 |
by Tom Moeller April 19, 2005
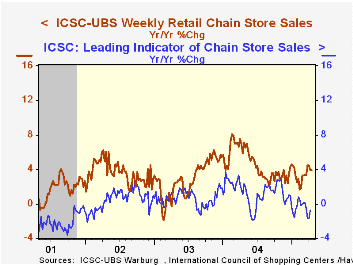
Chain store sales rose 1.0% last week according to the International Council of Shopping Centers (ICSC)-UBS survey. Coming on the heels of 0.3% increases during the prior two weeks, the increase lifted the average level in April up 0.4% versus March when sales moved sideways for much of the month.
During the last ten years there has been a 56% correlation between the y/y change in chain store sales and the change in non-auto retail sales less gasoline, as published by the US Census Department. Chain store sales correspond directly with roughly 14% of nonauto retail sales less gasoline.
The leading indicator of chain store sales from ICSC gained 0.3% (-0.8% y/y) for the first rise in four weeks.
The ICSC-UBS retail chain-store sales index is constructed using the same-store sales (stores open for one year) reported by 78 stores of seven retailers: Dayton Hudson, Federated, Kmart, May, J.C. Penney, Sears and Wal-Mart.
| ICSC-UBS (SA, 1977=100) | 04/16/05 | 04/09/05 | Y/Y | 2004 | 2003 | 2002 |
|---|---|---|---|---|---|---|
| Total Weekly Chain Store Sales | 457.4 | 452.9 | 3.9% | 4.6% | 2.9% | 3.6% |
by Louise Curley April 19 2005
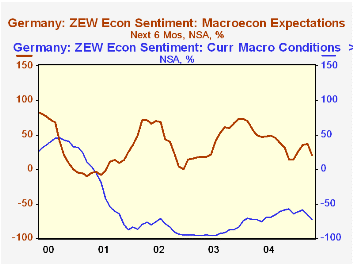
After becoming slightly more optimistic regarding the German economic outlook six months ahead in each of the first three months of this year, the institutional investors and analysts who respond to the ZEW survey became decidedly more pessimistic in April. The excess of optimists over pessimists dropped to 20.1% in April from 36.3% in March and from 59.1% a year ago.
The same but more pessimistic trend is apparent in the respondents' view of current conditions in Germany. In April, the percentage of respondents who considered current conditions bad was 73% greater than those who considered them good. The -73% figure compares with -66% in March and -72.5% in April of last year. In general, pessimistic appraisals of current conditions tend to outweigh the optimistic appraisals, while optimistic appraisals of expectations of future conditions tend to outweigh the pessimistic appraisals, as can be seen in the attached chart. ("Hope springs eternal in the human breast./ Man never is, but always to be, blest.")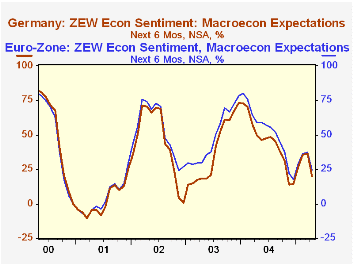
The ZEW survey also covers opinions on current conditions and expectations in the Euro zone as a whole. Since Germany represents such a large part of the Euro zone, it is not surprising that appraisals of current conditions and expectations in the Euro Zone tend to be similar to those of Germany. Expectations of economic conditions in Germany and in the Euro Zone are shown in the second chart.
With their pessimistic outlook for the economy, the institutional investors and analysts see little to cheer about in the profit outlook. There are only three industries, banking, telecommunications and information technology, in which the optimists outweigh the pessimists by more than 50%. The profit expectations for selected industries are shown in the table below.
| GERMANY % | Apr 05 | Mar 05 | Mar 04 | M/M Dif | Y/Y Dif | 2004 | 2003 | 2002 |
|---|---|---|---|---|---|---|---|---|
| Expectations | 20.1 | 36.3 | 49.7 | -16.2 | -29.6 | 49.6 | 38.4 | 45.3 |
| Current conditions | -73.0 | -66.0 | -42.5 | -7.0 | -0.5 | -67.7 | -92.6 | -83.3 |
| Profit expectations | ||||||||
| Banking | 52.4 | 55.5 | 67.2 | -3.1 | -14.8 | 59.6 | 30.5 | -8.4 |
| Telecommunications | 51.1 | 56.5 | 69.2 | -5.4 | -18.1 | 62.5 | 49.7 | 9.8 |
| Information technology | 52.5 | 59.4 | 71.9 | -6.9 | -19.4 | 63.0 | 45.2 | 17.6 |
| Consumer/trade | -26.9 | -22.6 | -13.7 | -4.3 | -13.2 | -18.2 | -33.7 | -28.9 |
| Machinery | 37.3 | 45.6 | 52.4 | -8.3 | -15.1 | 53.4 | 7.0 | 5.4 |
| Vehicle/automotive | -19.0 | -2.9 | 5.9 | -16.1 | -24.9 | -0.1 | -8.2 | -6.0 |
| EURO ZONE % | ||||||||
| Expectations | 24.6 | 37.3 | 59.1 | -12.7 | -34.5 | 52.1 | 48.9 | 53.1 |
| Current conditions | -32.8 | -24.8 | -55.4 | -5.0 | 21.6 | -41.4 | -78.5 | 67.5 |

Tom Moeller
AuthorMore in Author Profile »Prior to joining Haver Analytics in 2000, Mr. Moeller worked as the Economist at Chancellor Capital Management from 1985 to 1999. There, he developed comprehensive economic forecasts and interpreted economic data for equity and fixed income portfolio managers. Also at Chancellor, Mr. Moeller worked as an equity analyst and was responsible for researching and rating companies in the economically sensitive automobile and housing industries for investment in Chancellor’s equity portfolio. Prior to joining Chancellor, Mr. Moeller was an Economist at Citibank from 1979 to 1984. He also analyzed pricing behavior in the metals industry for the Council on Wage and Price Stability in Washington, D.C. In 1999, Mr. Moeller received the award for most accurate forecast from the Forecasters' Club of New York. From 1990 to 1992 he was President of the New York Association for Business Economists. Mr. Moeller earned an M.B.A. in Finance from Fordham University, where he graduated in 1987. He holds a Bachelor of Arts in Economics from George Washington University.
More Economy in Brief

 Global| Feb 05 2026
Charts of the Week: Balanced Policy, Resilient Data and AI Narratives
by:Andrew Cates

