 Global| Apr 19 2005
PPI Again Boosted by Petroleum
by:Tom Moeller
|in:Economy in Brief
Summary
The Producer Price Index for finished goods rose 0.7% in March, the largest one month rise since November and surpassed Consensus expectations for a 0.6% gain. Excluding food & energy prices, however, the PPI rose 0.1% for the second [...]
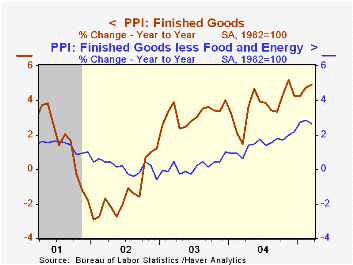
The Producer Price Index for finished goods rose 0.7% in March, the largest one month rise since November and surpassed Consensus expectations for a 0.6% gain. Excluding food & energy prices, however, the PPI rose 0.1% for the second consecutive month. Consensus expectations had been for a 0.2% increase.
Finished energy prices advanced 3.3% (15.3% y/y) as gasoline prices jumped 12.3% (31.9% y/y) and fuel oil prices rose 16.1% (55.8% y/y). In April, prices for crude petroleum and for refined petroleum products are down versus March.
Core finished consumer goods prices rose 0.1% (2.6% y/y). Consumer durable goods prices fell by 0.1% (1.6% y/y) for the second consecutive monthly decline. Passenger cars fell again (+1.1% y/y) and home electronic equipment prices were off 0.2% (-4.0% y/y). Household appliance prices rose 0.3% (1.8% y/y).
Core consumer nondurable goods prices rose 0.1% (3.3% y/y) and capital goods prices increased 0.3% (+2.7% y/y). Finished food prices rose 0.3% (3.8% y/y).
Intermediate goods prices posted the largest increase since October. The 1.0% advance reflected a 3.7% (16.7% y/y) gain in energy prices. Core intermediate prices rose 0.3% though plywood prices fell (-13.9% y/y) as did hardwood lumber prices (-0.8% y/y).
Crude prices jumped 4.3% on the strength of surging oil prices, up 5.5% (28.4% y/y). Core crude prices rose for the first month in four. The 1.0% increase reflected price jumps for copper (15.9% y/y) & aluminum (8.9% y/y) base scrap. During the last thirty years "core" crude prices have been a fair indicator of industrial sector activity with a 48% correlation between the six month change in core crude prices and the change in factory sector industrial production.
Inflation Targeting under Commitment and Discretion from the Federal Reserve Bank of San Francisco is available here.
| Producer Price Index | Mar | Feb | Y/Y | 2004 | 2003 | 2002 |
|---|---|---|---|---|---|---|
| Finished Goods | 0.7% | 0.4% | 4.9% | 3.6% | 3.2% | -1.3% |
| Core | 0.1% | 0.1% | 2.6% | 1.5% | 0.2% | 0.1% |
| Intermediate Goods | 1.0% | 0.7% | 8.4% | 6.6% | 4.6% | -1.5% |
| Core | 0.3% | 0.5% | 7.6% | 5.7% | 2.0% | -0.5% |
| Crude Goods | 4.3% | -1.6% | 10.8% | 17.6% | 25.1% | -10.6% |
| Core | 1.0% | -3.0% | 3.4% | 26.5% | 12.4% | 3.8% |

Tom Moeller
AuthorMore in Author Profile »Prior to joining Haver Analytics in 2000, Mr. Moeller worked as the Economist at Chancellor Capital Management from 1985 to 1999. There, he developed comprehensive economic forecasts and interpreted economic data for equity and fixed income portfolio managers. Also at Chancellor, Mr. Moeller worked as an equity analyst and was responsible for researching and rating companies in the economically sensitive automobile and housing industries for investment in Chancellor’s equity portfolio. Prior to joining Chancellor, Mr. Moeller was an Economist at Citibank from 1979 to 1984. He also analyzed pricing behavior in the metals industry for the Council on Wage and Price Stability in Washington, D.C. In 1999, Mr. Moeller received the award for most accurate forecast from the Forecasters' Club of New York. From 1990 to 1992 he was President of the New York Association for Business Economists. Mr. Moeller earned an M.B.A. in Finance from Fordham University, where he graduated in 1987. He holds a Bachelor of Arts in Economics from George Washington University.
More Economy in Brief

 Global| Feb 05 2026
Charts of the Week: Balanced Policy, Resilient Data and AI Narratives
by:Andrew Cates

