 Global| Feb 16 2007
PPI Eases with Lower Energy; Core Rate Steady
Summary
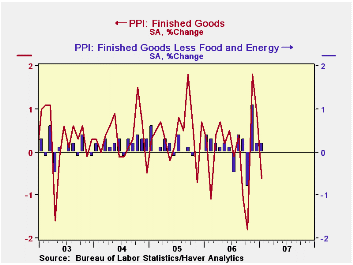
The producer price index for finished goods fell 0.6% following its 0.9% rise in December. This result was close to consensus forecasts of a 0.5% decline. It was, as anticipated, led by a drop in energy prices; this ran 4.6%. Food [...]

The producer price index for finished goods fell 0.6% following its 0.9% rise in December. This result was close to consensus forecasts of a 0.5% decline. It was, as anticipated, led by a drop in energy prices; this ran 4.6%. Food prices continued rising, adding 1.1% after December's 1.5%.
The core finished goods PPI rose 0.2%, the same as in December and also equal to forecasts. Note that the BLS conducted its annual seasonal adjustment revisions on these data, so 2006 figures quoted here may differ from those reported last month.
Energy prices fell sharply in January: gasoline was down 13.0% in the month and 9.7% from January 2006. Fuel oil fell 8.3% from December and 2.3% from a year ago. Natural gas prices were off 1.9% in January, carrying the 12-month change to -15.1%.
Finished consumer goods prices less food & energy rose 0.2% (1.5% y/y); the seasonal factor revisions shaved 0.1% off the December increase, leaving it at 0.1%. Within that subset, passenger car prices edged down 0.1% (-0.5% y/y) after December's 0.2% decline.
Capital equipment prices increased 0.2% (2.3% y/y), with December's rise trimmed to 0.1%. January light truck prices were off 1.4%; these prices have settled down after their whipsaw in October and November, and now, notably, they are just 0.3% above year-earlier readings.
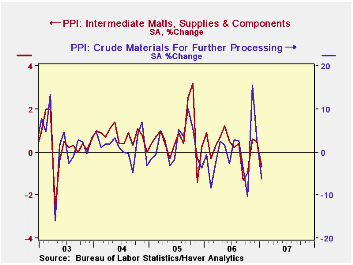
Intermediate goods prices declined 0.7% in January and were a modest 1.2% above January 2006. The corresponding "core" index was unchanged for a second month in a row and it has slowed to a 3.8% y/y increase compared with 5-6% increases across much of the last three years. The recent slowdown is showing in building materials: lumber, plasterboard and the like, and in metal products.
The crude materials PPI was down 6.3%, led by the drop in crude petroleum prices of 9.2%; this put the total crude index down 8.0% y/y. Judging by the behavior of spot prices, about half of that drop in oil has since reversed. The core crude materials PPI was up 1.6%, with increases in logs and timber and in iron and steel scrap. In contrast, nonferrous ores and copper scrap are slowing down after their dramatic rises through the middle of last year.
| Producer Price Index | Jan 2007 | Dec 2006 | Nov 2006 | Y/Y | 2006 | 2005 | 2004 |
|---|---|---|---|---|---|---|---|
| Finished Goods | -0.6 | 0.9% | 1.8% | 0.2% | 2.9% | 4.9% | 3.6% |
| Core | 0.2 | 0.2% | 1.1% | 1.7% | 1.4% | 2.4% | 1.5% |
| Intermediate Goods | -0.7 | 0.5% | 0.6% | 1.2% | 6.5% | 8.0% | 6.6% |
| Core | 0.0 | 0.0% | -0.4% | 3.8% | 6.1% | 5.5% | 5.7% |
| Crude Goods | -6.3 | 2.8% | 15.5% | -8.0% | 1.7% | 14.6% | 17.5% |
| Core | 1.6 | 0.5% | 0.4% | 17.8% | 21.0% | 4.9% | 26.5% |
Carol Stone, CBE
AuthorMore in Author Profile »Carol Stone, CBE came to Haver Analytics in 2003 following more than 35 years as a financial market economist at major Wall Street financial institutions, most especially Merrill Lynch and Nomura Securities. She had broad experience in analysis and forecasting of flow-of-funds accounts, the federal budget and Federal Reserve operations. At Nomura Securities, among other duties, she developed various indicator forecasting tools and edited a daily global publication produced in London and New York for readers in Tokyo. At Haver Analytics, Carol was a member of the Research Department, aiding database managers with research and documentation efforts, as well as posting commentary on select economic reports. In addition, she conducted Ways-of-the-World, a blog on economic issues for an Episcopal-Church-affiliated website, The Geranium Farm. During her career, Carol served as an officer of the Money Marketeers and the Downtown Economists Club. She had a PhD from NYU's Stern School of Business. She lived in Brooklyn, New York, and had a weekend home on Long Island.
More Economy in Brief
 Global| Feb 05 2026
Charts of the Week: Balanced Policy, Resilient Data and AI Narratives
by:Andrew Cates


