 Global| Apr 21 2008
Producer and Consumer Price Inflation in Eastern Europe
Summary
Four countries, Russia, Slovenia, Latvia and Estonia in Eastern Europe reported Producer Price Indexes (PPI) today. Except for Estonia where producer price inflation declined by 69 basis points in March, the other countries showed [...]
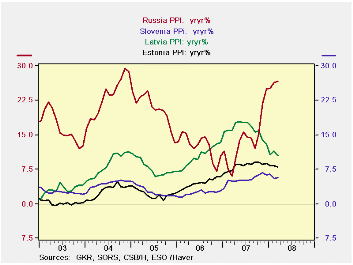
Four countries, Russia, Slovenia, Latvia and Estonia in Eastern Europe reported Producer Price Indexes (PPI) today. Except for Estonia where producer price inflation declined by 69 basis points in March, the other countries showed increases: in Slovenia, a rise of 17 basis points; in Latvia, a rise of 94 basis points and in Russia a rise of 230 basis points. The first chart shows producer price inflation in the four countries. While increases in producer price inflation have tended to moderate in Estonia, Latvia and Slovenia, the increase in Russia has accelerated. In March the producer price inflation, represented by the year to year rise in Russia's PPI was 26.6%, nearing the peak of 28.8% reached at the end of 2004 and well above producer price inflation in the other three countries.
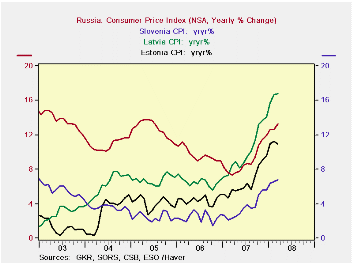
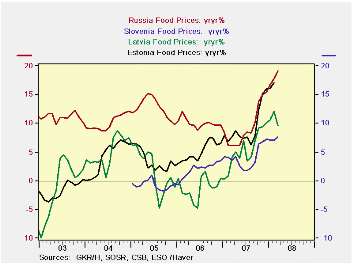
Earlier this month consumer price indexes (CPI) for these countries were released. Inflation at the consumer level, measured by the year to year changes in the CPI is shown in the second chart and noted in the table below. Consumer price inflation in all four countries has shown a similar rising trend since early 2007. In contrast to producer price inflation, it is Latvia where consumer price inflation is currently highest at 16.7% and Russia, second highest at 13.3%. So far in 2008, inflation at the consumer level has been higher than that at the producer level for all except Russia where producer inflation has been twice as high as consumer price inflation. The recent steep rise world in food prices may account for the relative greater increase in the consumer price index since food has a greater weight in the CPI than in the PPI. Like the rest of the world, these countries have seen record rises in food prices as shown in the third chart.
| PPI AND CPI INFLATION (%) | Mar 08 | Feb 08 | Mar 07 | M/M Chg | Y/Y Chg | 2007 | 2006 | 2005 |
|---|---|---|---|---|---|---|---|---|
| PPI INFLATION | ||||||||
| RUSSIA | 26.59 | 26.38 | 5.95 | 2.30 | 20.24 | 14.30 | 12.41 | 20.55 |
| SLOVENIA | 5.71 | 5.54 | 5.01 | 0.17 | 0.70 | 5.37 | 2.34 | 2.70 |
| LATVIA | 10.47 | 11.41 | 15.99 | 0.94 | 5.52 | 16.14 | 10.36 | 7.81 |
| ESTONIA | 7.98 | 8.29 | 7.30 | -0.69 | 0.68 | 8.27 | 4.48 | 2.11 |
| CPI INFLATION | ||||||||
| RUSSIA | 13.29 | 12.64 | 7.39 | 0.65 | 5.90 | 9.00 | 9.68 | 12.68 |
| SLOVENIA | 6.84 | 6.52 | 2.37 | 0.32 | 4.47 | 3.61 | 2.46 | 2.49 |
| LATVIA | 16.74 | 16.88 | 8.49 | -0.14 | 8.25 | 10.09 | 6.53 | 6.77 |
| ESTONIA | 10.94 | 11.26 | 5.71 | -0.32 | 5.23 | 1.60 | 4.43 | 4.09 |


