 Global| Nov 01 2010
Purchasing Managers' Surveys And GDP In Asia
Summary
Purchasing Managers' surveys of Asian manufacturing for October show weakness in Japan, Taiwan and Korea, but strength in India and China. The results of the surveys are expressed in the form of diffusion indexes. Results above 50% [...]
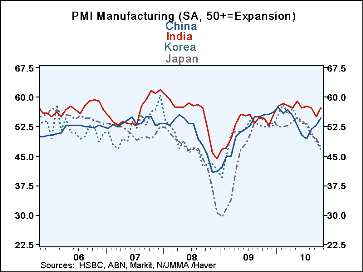
Purchasing Managers' surveys of Asian manufacturing for October show weakness in Japan, Taiwan and Korea, but strength in India and China. The results of the surveys are expressed in the form of diffusion indexes. Results above 50% measure the degree to which the economy is in an expansion phase while results below 50% show the degree to which an economy is in a contracting phase. Rarely have the diffusion indexes been above 60% or below 30% for the four countries shown in the first chart. In October, 2007, a high point of 61.85% for the index was reached in India and in January 2009 a low point of 29.63% was reached in Japan. China and India are well into the expansion phase, particularly India at 57.21%. On the other hand, the three countries with indexes below 50% are only moderately below 50% and still well above the low of 30%.
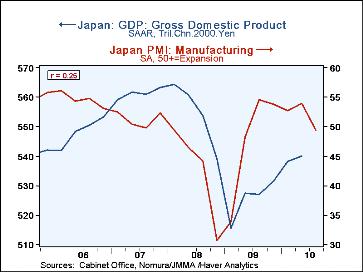
Purchasing Managers' surveys are closely watched as indicators of future economic trends. As an example, the second chart shows the diffusion index of Japan's purchasing manager's survey on a quarterly basis compared with Japan's real GDP. The correlation of .87 suggests a relatively good fit.
Should this relationship hold, we should expect some slowing in the economies of Japan, Korea and Taiwan in the last quarter of 2010 and full steam ahead in China and India.
| Markit Economics Purchasing Managers' Survey for Manufacturing |
Oct '10 | Sep '10 |
|---|---|---|
| China | 54.7977 | 52.8851 |
| India | 57.2143 | 55.1309 |
| Taiwan | 48.5609 | 49.0084 |
| Korea | 46.7488 | 48.8055 |
| Japan | 47.2083 | 49.4629 |


