 Global| May 15 2020
Record Drop in Industrial Production; Output at Level Last Seen in March 2010
Summary
• Industrial production plummeted 11.2% in April led by a 13.7% fall in manufacturing output. • These are the largest single monthly declines on record; data goes back to 1921. • Lowest level of manufacturing activity since August [...]
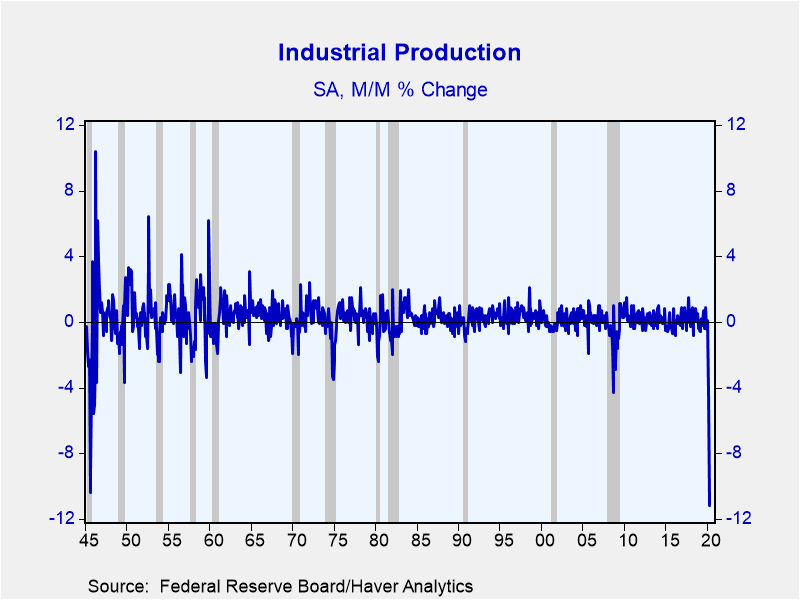
• Industrial production plummeted 11.2% in April led by a 13.7% fall in manufacturing output.
• These are the largest single monthly declines on record; data goes back to 1921.
• Lowest level of manufacturing activity since August 1997.
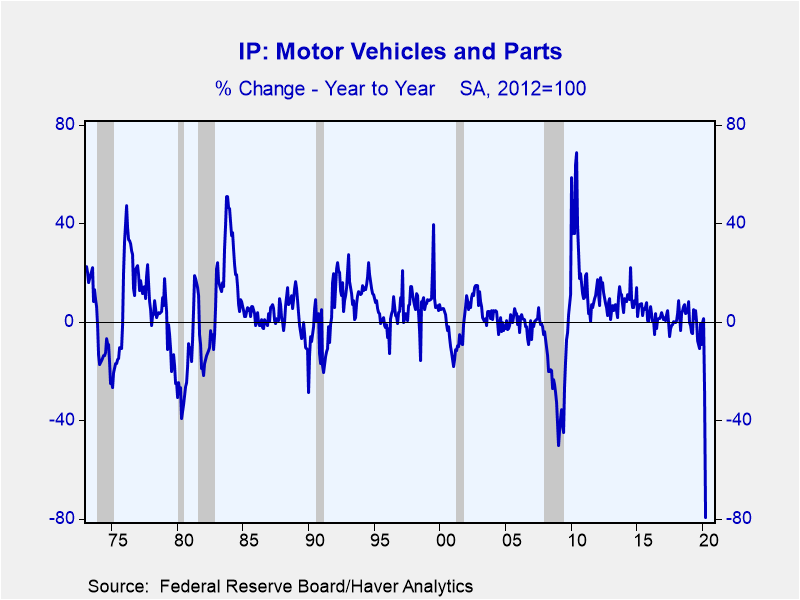
• Durable goods output dropped an unprecedented 19.3% driven by a 71.7% collapse in motor vehicle output.
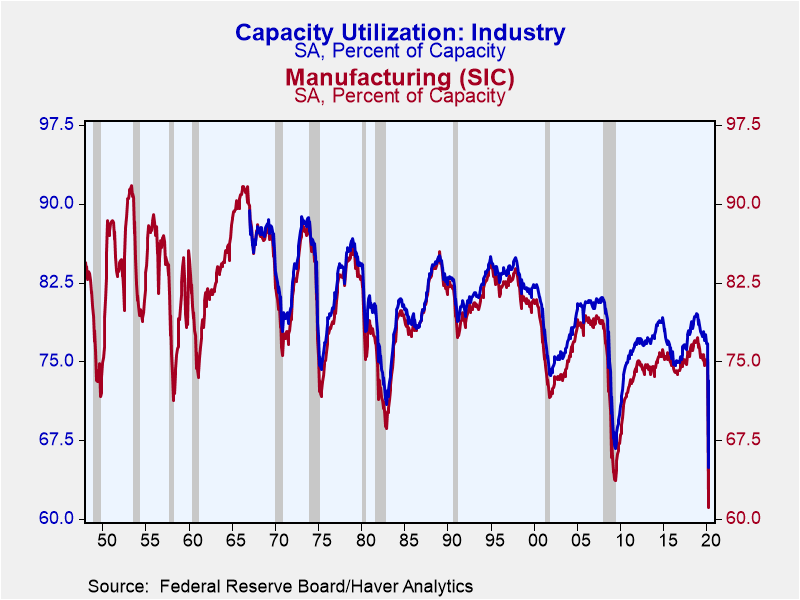
• Capacity utilization for autos at just 15.4%.
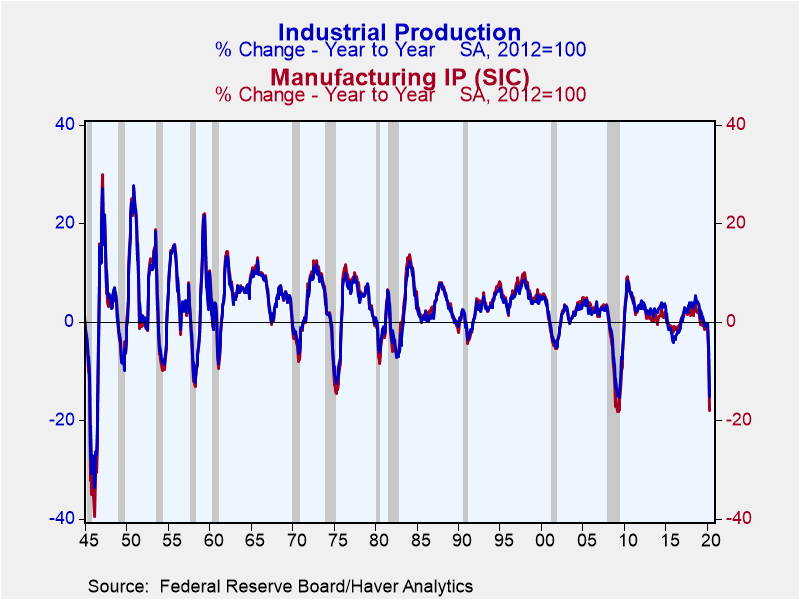
Industrial production fell 11.2% in April (-15.0% year-on-year). This is the largest single monthly decline on record. This surpassed the 10.4% drop in September 1945, when the U.S. was ending its World War II production surge, as well as the 9.8% decline in November 1937, in the midst of the Great Depression. The Action Economics Survey forecast an 11.9% fall.
Output in March was revised slightly higher to -4.5% from -5.4%. Output is down 15.3% over the last two months, only surpassed by the 1945 and 1937 periods which experienced multiple months of near-double digit declines. On a year-on-year basis, the current drop of 15.0% was last seen in 2009 and prior to that 1946, as a result of the continuation of the WWII drawdowns. The level of industrial activity is now back to levels last seen in March 2010.
Manufacturing production collapsed a record 13.7% during April (-18.0% y/y), taking factory output to its lowest level since August 1997. The March revision, as well as two-month and year-on-year growth followed the same pattern described above for overall industrial activity. Utilities declined 0.9% (-3.8% y/y) and mining fell 6.1% (-7.5% y/y). While large, this change is not notable, because mining activity shows large month-to-month volatility as a result of variable commodity prices.
Manufacturing of durable goods dropped an unprecedented 19.3% (-25.5% y/y) in April; this data as well as all sectoral data discussed below goes back to 1972. All major durable goods sectors were down -- with many of them all-time declines - led by an astounding 71.7% collapse in motor vehicle production. This follows a 30% drop in March putting auto output down 80.2% from its February level and -79.3% y/y. The auto sector utilized a record low 15.4% of its capacity in April (data goes back to 1948). Interestingly, while many of the heavy manufacturing sectors saw double digit declines, high tech output was down just 3.0% (+4.2% y/y), perhaps since this output is done in clean rooms by small staffs.
Nondurable output experienced an unprecedented 8.2% monthly decline in in April and was down 10.0% y/y; the record 13.8% y/y drop occurred in 1975. All major categories fell including food, beverage and tobacco (-7.1%; -6.7% y/y).
Output of business equipment, an indicator of capital spending, plummeted a record 17.3% in April (-25.9% y/y); data goes back to 1947.
Capacity utilization fell to an all-time low of 64.9% from 73.2% - the largest monthly decline in history; data goes back to 1967.The Action Economics Survey expected 63.5% in April. Factory sector use dropped a record 9.7 percentage points to an unprecedented 61.1%; data goes back to 1948.
Industrial production and capacity are included in Haver's USECON database. Additional detail on production and capacity can be found in the IP database. The expectations figures come from the AS1REPNA database.
| Industrial Production (SA, % Change) | Apr | Mar | Feb | Apr Y/Y | 2019 | 2018 | 2017 |
|---|---|---|---|---|---|---|---|
| Total Output | -11.2 | -4.5 | 0.1 | -15.0 | 0.9 | 3.9 | 2.3 |
| Manufacturing | -13.7 | -5.5 | 0.0 | -18.0 | -0.2 | 2.3 | 2.0 |
| Durable Goods | -19.3 | -8.2 | 0.3 | -25.5 | 0.7 | 3.4 | 2.2 |
| Motor Vehicles | -71.7 | -30.0 | 3.4 | -79.3 | -2.4 | 4.1 | 0.0 |
| Selected High Tech | -3.0 | 0.0 | -1.1 | 4.2 | 5.1 | 6.4 | 2.6 |
| Nondurable Goods | -8.2 | -2.6 | -0.5 | -10.0 | -0.7 | 1.9 | 1.9 |
| Utilities | -0.9 | -1.9 | 3.6 | -3.8 | -0.8 | 4.4 | -0.8 |
| Mining | -6.1 | -1.1 | -1.4 | -7.5 | 7.1 | 12.4 | 7.4 |
| Capacity Utilization (%) | 64.9 | 73.2 | 76.7 | 77.8 | 77.8 | 78.7 | 76.5 |
| Manufacturing | 61.1 | 70.8 | 75.0 | 75.4 | 75.6 | 76.6 | 75.1 |
Gerald D. Cohen
AuthorMore in Author Profile »Gerald Cohen provides strategic vision and leadership of the translational economic research and policy initiatives at the Kenan Institute of Private Enterprise.
He has worked in both the public and private sectors focusing on the intersection between financial markets and economic fundamentals. He was a Senior Economist at Haver Analytics from January 2019 to February 2021. During the Obama Administration Gerald was Deputy Assistant Secretary for Macroeconomic Analysis at the U.S. Department of Treasury where he helped formulate and evaluate the impact of policy proposals on the U.S. economy. Prior to Treasury, he co-managed a global macro fund at Ziff Brothers Investments.
Gerald holds a bachelor’s of science from the Massachusetts Institute of Technology and a Ph.D. in Economics from Harvard University and is a contributing author to 30-Second Money as well as a co-author of Political Cycles and the Macroeconomy.
More Economy in Brief
 Global| Feb 05 2026
Charts of the Week: Balanced Policy, Resilient Data and AI Narratives
by:Andrew Cates


