 Global| Oct 26 2010
Reports Of European Business And Consumer Confidence
Summary
A number of reports on consumer and business confidence were released today--four pertaining to the consumer for France, Germany, Italy and Switzerland and one pertaining to business for the Netherlands. In Switzerland, the latest [...]
 A number of reports on consumer and business confidence were released today--four pertaining to the consumer for France,
Germany, Italy and Switzerland and one pertaining to business for the Netherlands.
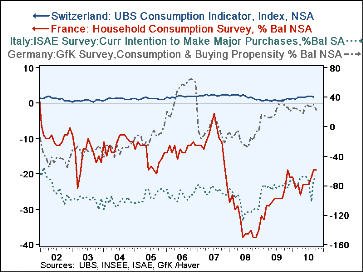
In Switzerland, the latest data refer to the month of September when the UBS Consumption indicator fell to 1.658 from 1.945 in August, the highest point so far this year. Data for consumption or buying intentions for France, Italy and Germany are available through October. While there has been some improvement in the propensity to spend in Italy and France, it has resulted from a decline of pessimists rather than from an increase of optimists, In October, the pessimists outweighed the optimists by 68% in Italy and by 19% in France. Only Germany shows an excess of optimists, however, the excess of optimists declined in October to 22.5% from 30.7% in September. Consumption indicators for the four countries are shown in the first chart.
The components of Germany's GfK survey are shown in the second chart and in the table below. It is clear from the data that the most important factor in the overall Consumer Climate measure is Economic Expectations. In October, the balance of opinion on the overall measure increased to 4.9% from 4.3% in September in spite of declines of 9.2 percentage points in the balance of opinion on Income Expectations and 8.2 percentage points on the balance of opinion on the Consumer and Buying Propensity. The 2.5 increase in the balance of opinion on Economic Expectations, apparently outweighed the declines in the other components. While it does not yet have November data for the components, GfK forecasts that the overall Consumer Climate in November will remain steady at 4.9%..Business confidence in the Netherlands has risen sharply from the low point in February, 2009, when the balance of opinion was -23.5%. The balance is now a positive 0.5% and is just one basis point above the average of the series.
| Consumption Indicators | Oct 10 |
Sep 10 |
Aug 10 |
Jul 10 |
Jun 10 |
May 10 |
Apr 10 |
Mar 10 |
Feb 10 |
Jan 10 |
|---|---|---|---|---|---|---|---|---|---|---|
| Switz: UBS Consumption Indicator, Index, NSA | -- | 1.658 | 1.945 | 1.881 | 1.780 | 1.720 | 1.828 | 1.672 | 1.173 | 1.299 |
| Germany: GfK Cons % Bal NSA | 22.5 | 30.7 | 27.9 | 27.9 | 30.4 | 18.4 | 21.6 | 23.4 | 24.2 | 25.4 |
| Italy: ISAE Consumer Survey % Bal SA | -68 | -72 | -107 | -74 | -68 | -68 | -70 | -77 | -78 | -72 |
| France INSEE HH Consumption Survey % Bal NSA | -19 | -19 | -21 | -23 | -23 | -23 | -26 | -23 | -24 | -21 |
| Germany GFK Survey % Bal NSA | ||||||||||
| Consumer Climate | 4.9 | 4.3 | 4.1 | 3.6 | 3.5 | 3.7 | 3.4 | 3.2 | 3.3 | 3.4 |
| Cons & Buying Propensity | 22.5 | 30.7 | 27.9 | 27.9 | 30.4 | 18.4 | 21.6 | 23.4 | 24.2 | 25.4 |
| Income Expectations | 36.0 | 45.2 | 36.0 | 29.1 | 8.2 | 23.7 | 35.2 | 13.5 | 12.0 | 12.5 |
| Economic Expectations | 56.0 | 53.5 | 46.6 | 36.8 | 5.5 | 3.9 | 22.5 | 4.5 | -5.6 | 1.5 |
| Netherlands % Bal SA | ||||||||||
| Business Confidence | 0.5 | -0.1 | 0.6 | -2.4 | -0.7 | 0.4 | -1.4 | -3.1 | -5.0 | -6.5 |
More Economy in Brief
 Global| Feb 05 2026
Charts of the Week: Balanced Policy, Resilient Data and AI Narratives
by:Andrew Cates


