 Global| May 14 2003
Retail Sales Dip
by:Tom Moeller
|in:Economy in Brief
Summary
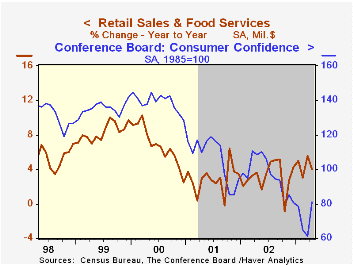
Retail sales fell unexpectedly in April. A 0.1% dip was versus Consensus expectations for a 0.4% rise. The drop followed a 2.3% March gain that was revised up slightly from the advance report. Sales excluding motor vehicles and parts [...]

Retail sales fell unexpectedly in April. A 0.1% dip was versus Consensus expectations for a 0.4% rise. The drop followed a 2.3% March gain that was revised up slightly from the advance report.
Sales excluding motor vehicles and parts dealers fell 0.9% versus Consensus expectations for a 0.2% rise. The March gain in nonauto sales also was revised up.
Sales at gasoline service stations fell a sharp 5.9% owing to a 6.1% decline in retail gasoline prices. Excluding gasoline, nonauto retail sales fell 0.4% (+2.4% y/y) following a 1.6% gain in March, revised up from 1.2%.
Motor vehicle dealers' sales rose 2.5% following a sharp 5.0% gain in March. Unit sales of light vehicles rose 1.9% last month to 16.50 mil. (AR).
Declines in sales were widespread last month but were most pronounced at apparel and accessory stores where sales fell 3.2% (-0.9% y/y). That followed a 3.0% March gain. Much of the weakness in these sales reflects lower prices that have been falling steadily since 1998.
Sales at general merchandise stores fell 0.6% (1.2% y/y) following a scant 0.1% March gain.
Furniture, home furnishing and electronics store sales dipped 0.1% (1.3% y/y) following an upwardly revised 2.8% March gain.
| April | Mar | Y/Y | 2002 | 2001 | 2000 | |
|---|---|---|---|---|---|---|
| Retail Sales & Food Services | -0.1% | 2.3% | 4.1% | 3.2% | 3.9% | 6.7% |
| Excluding Autos | -0.9% | 1.5% | 2.8% | 3.7% | 2.9% | 7.4% |
by Tom Moeller May 14, 2003

Prices for imported commodities fell 2.7% last month versus Consensus expectations for a 0.5% decline. The gain in prices in March was revised up slightly.
Petroleum import prices fell sharply last month, down 16.2% following a 0.1% March dip. So far in May the price of West Texas Intermediate crude has been around $26.50 versus $28.25/bbl averaged in April.
Nonpetroleum import prices fell 0.9%, reversing just about all of the 1.0% gain in March. Price weakness was across the board. Food prices fell 0.5% (6.1% y/y) and industrial supplies and materials fell 9.7% (10.2% y/y).
Prices of imported capital goods were unchanged (-1.5% y/y) and have been about unchanged since October. Nonauto consumer goods prices also were unchanged (-0.2% y/y) and have been flat since last year. Motor vehicle prices were flat (0.4% y/y) for the second month.
Export prices fell 0.1% following gains in the prior three months.
| Import/Export Prices (NSA) | April | Mar | Y/Y | 2002 | 2001 | 2000 |
|---|---|---|---|---|---|---|
| Import - All Commodities | -2.7% | 0.7% | 2.3% | -2.5% | -3.5% | 6.5% |
| Petroleum | -16.2% | -0.1% | 15.9% | 3.0% | -17.2% | 66.5% |
| Nonpetroleum | -0.9% | 1.0% | 0.9% | -2.4% | -1.5% | 1.0% |
| Export - All Commodities | -0.1% | 0.2% | 1.6% | -1.0% | -0.8% | 1.6% |
by Tom Moeller May 14, 2003

The index of mortgage applications compiled by the Mortgage Bankers Association rose 13.7% last week and added to a 18.6% jump the week prior.
Applications to refinance took off again as interest rates fell. Refinancing applications rose 19.3% w/w following a 19.4% gain the week prior. Refi's were still down 22.8% from the March peak.
Interest rates on a conventional 30-Year mortgage fell to a record low with the effective rate at 5.55% versus 5.83% the prior week. The effective rate on a 15-year mortgage was 5.06%.
Applications for home purchase fell a slight 0.2% (16.5% y/y) following a 16.9% jump the week prior.
During the last ten years there has been a 52% correlation between the y/y change in purchase applications and the change in new plus existing home sales.
The average size of a mortgage loan application fell slightly to $178,300 (-3.1% y/y). The average size of an application for home purchase fell to $192,000 (+4.2% y/y). The average size of an application to refinance slumped 4.0% to $172,000 (-6.2% y/y). March figures were revised down.
Visit the Mortgage Bankers Association site at www.mbaa.org.
| MBA Mortgage Applications (3/16/90=100) | 5/02/03 | 4/25/03 | 2002 | 2001 | 2000 |
|---|---|---|---|---|---|
| Total Market Index | 1,246.6 | 1,050.8 | 799.7 | 625.6 | 322.7 |
| Purchase | 416.0 | 356.0 | 354.7 | 304.9 | 302.7 |
| Refinancing | 6,077.8 | 5,092.0 | 3,388.0 | 2,491.0 | 438.8 |
Tom Moeller
AuthorMore in Author Profile »Prior to joining Haver Analytics in 2000, Mr. Moeller worked as the Economist at Chancellor Capital Management from 1985 to 1999. There, he developed comprehensive economic forecasts and interpreted economic data for equity and fixed income portfolio managers. Also at Chancellor, Mr. Moeller worked as an equity analyst and was responsible for researching and rating companies in the economically sensitive automobile and housing industries for investment in Chancellor’s equity portfolio. Prior to joining Chancellor, Mr. Moeller was an Economist at Citibank from 1979 to 1984. He also analyzed pricing behavior in the metals industry for the Council on Wage and Price Stability in Washington, D.C. In 1999, Mr. Moeller received the award for most accurate forecast from the Forecasters' Club of New York. From 1990 to 1992 he was President of the New York Association for Business Economists. Mr. Moeller earned an M.B.A. in Finance from Fordham University, where he graduated in 1987. He holds a Bachelor of Arts in Economics from George Washington University.
More Economy in Brief
 Global| Feb 05 2026
Charts of the Week: Balanced Policy, Resilient Data and AI Narratives
by:Andrew Cates


