 Global| Jan 14 2003
Retail Sales Lifted by Higher Vehicle Sales
by:Tom Moeller
|in:Economy in Brief
Summary
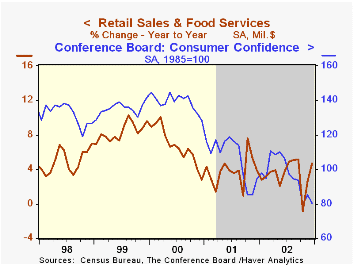
Retail sales rose strongly last month but less than Consensus expectations for a 1.4% gain. Sales in November were revised down due to a lowered gain for nonauto sales. The 3.4% gain in retail sales for all of 2002 was the weakest [...]

Retail sales rose strongly last month but less than Consensus expectations for a 1.4% gain. Sales in November were revised down due to a lowered gain for nonauto sales. The 3.4% gain in retail sales for all of 2002 was the weakest yearly increase since the recession year of 1991.
Sales excluding motor vehicles and parts dealers were quite a bit weaker than Consensus expectations for a 0.3% gain. The November increase had been previously reported as 0.5%.
Furniture and home furnishing store sales rose 0.3% (2.2% y/y) following a 0.8% November gain that was half the initially reported estimate. Furniture sales were unchanged. Sales at electronics and appliance stores rose 0.6%. Gains in both categories were revised lower for November.
Sales at general merchandise stores rose 0.3%, but the November increase was revised away to -0.9% (2.8% y/y).
Apparel store sales rose 0.8% (2.9% y/y) and reversed a 0.8% November drop that was shallower than initially reported.
Motor vehicle dealers' sales rose 5.0% following an upwardly revised November estimate. Unit sales of light vehicles rose 14.2% last month to 18.32 mil.
Sales at gasoline service stations rose 0.7% (16.6% y/y) following an upwardly revised 0.9% November gain.
| Dec | Nov | Y/Y | 2002 | 2001 | 2000 | |
|---|---|---|---|---|---|---|
| Retail Sales & Food Services | 1.2% | 0.9% | 4.6% | 3.4% | 3.8% | 6.7% |
| Excluding Autos | 0.0% | 0.3% | 4.3% | 3.9% | 3.4% | 7.3% |
by Tom Moeller January 14, 2003

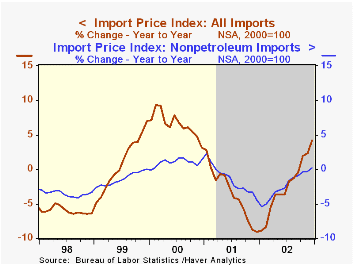
Prices for imported commodities rose in line with Consensus expectations for a 0.7% gain. Despite the recent strength in oil, overall import prices for 2002 fell for the fourth year in the last five.
Petroleum import prices rose sharply and by the most for any month since April. Prices were lifted by the labor strike in Venezuela and Mideast concerns. So far in January the price of Brent Crude Oil has been near $30.00/bbl. versus the $28.23/bbl averaged in December.
Nonpetroleum import prices rose slightly following the slight November drop which was revised down.
Prices of imported capital goods fell 0.1% (-2.5% y/y), the fourth down month in a row. Nonauto consumer goods prices rose a slight 0.1% (-0.7% y/y). Imported motor vehicle prices also were up just 0.1% (0.5% y/y).
Export prices fell for the second month in three. Price declines were across the board except for nonauto consumer goods which were unchanged and auto prices which rose 0.1%.
| Import/Export Prices (NSA) | Dec | Nov | Y/Y | 2002 | 2001 | 2000 |
|---|---|---|---|---|---|---|
| Import - All Commodities | 0.7% | -1.0% | 4.2% | -2.5% | -3.5% | 6.5% |
| Petroleum | 7.4% | -9.2% | 57.9% | 2.9% | -17.2% | 66.5% |
| Nonpetroleum | 0.1% | -0.1% | 0.2% | -2.4% | -1.5% | 1.0% |
| Export - All Commodities | -0.2% | 0.1% | 1.0% | -1.0% | -0.8% | 1.6% |
by Tom Moeller January 14, 2003

Chain store sales rose a slight 0.3% following the slight decline of a week earlier according to the BTM-UBSW survey.
Sales so far in January were up 2.0% from the December average due to the huge sales gain during Christmas week.
During the last ten years there has been a 49% correlation between the year-to-year percent change in monthly chain store sales and the change in GAF retail sales. That correlation rose to 64% during the last five years.
| BTM-UBSW (SA, 1977=100) | 1/11/03 | 1/04/03 | Y/Y | 2002 | 2001 | 2000 |
|---|---|---|---|---|---|---|
| Total Weekly Retail Chain Store Sales | 409.1 | 408.0 | 2.9% | 3.6% | 2.1% | 3.4% |
by Tom Moeller January 14, 2003

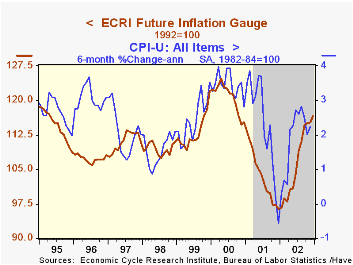
The Future Inflation Gauge (FIG) published by the Economic Cycle Research Institute (ECRI) continued it's rise of 2002 in December. The index rose 1.2% following gains in all but one of the months last year.
The indicator's six-month growth rate eased a bit to a still strong 21.2%.
The monthly FIG has a mean lead of 11 months and a median lead of 9 months at inflation cycle turns .
The eight components of the FIG are commodity prices, employment measures, capacity measures, import prices, the yield spread, real estate and debt.
For more on ECRI visit businesscycle.com.
| ECRI | Dec | Nov | Y/Y | 2002 | 2001 | 2000 |
|---|---|---|---|---|---|---|
| Future Inflation Gauge | 116.6 | 115.2 | 17.8% | 3.1% | -14.2% | 6.5% |
by Tom Moeller January 14, 2003

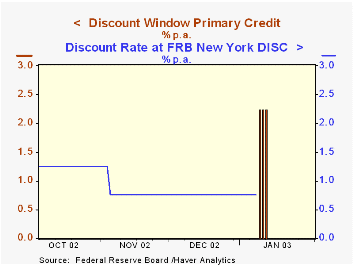
Effective last Thursday, revisions for the usage of the Federal Reserve's discount window went into effect.
The change has no effect on the stance of monetary policy, but it does raise the discount rate above the Federal funds rate.
For the Fed's release outlining the new rules which were issued this past fall, click here.
Tom Moeller
AuthorMore in Author Profile »Prior to joining Haver Analytics in 2000, Mr. Moeller worked as the Economist at Chancellor Capital Management from 1985 to 1999. There, he developed comprehensive economic forecasts and interpreted economic data for equity and fixed income portfolio managers. Also at Chancellor, Mr. Moeller worked as an equity analyst and was responsible for researching and rating companies in the economically sensitive automobile and housing industries for investment in Chancellor’s equity portfolio. Prior to joining Chancellor, Mr. Moeller was an Economist at Citibank from 1979 to 1984. He also analyzed pricing behavior in the metals industry for the Council on Wage and Price Stability in Washington, D.C. In 1999, Mr. Moeller received the award for most accurate forecast from the Forecasters' Club of New York. From 1990 to 1992 he was President of the New York Association for Business Economists. Mr. Moeller earned an M.B.A. in Finance from Fordham University, where he graduated in 1987. He holds a Bachelor of Arts in Economics from George Washington University.
More Economy in Brief
 Global| Feb 05 2026
Charts of the Week: Balanced Policy, Resilient Data and AI Narratives
by:Andrew Cates


