Global| Dec 28 2009
Rising Exports Fuel Rise in Japanese Industrial Production
Summary
Industrial production in Japan was reported today to have increased 2.6% in November to 88.3 (2005=100). This was the ninth month in which production increased from the low of 69.5 reached in February of this year. It is, however, [...]
 Industrial
production in Japan was reported today to have increased 2.6% in
November to 88.3 (2005=100). This was the ninth month in
which production increased from the low of 69.5 reached in February of
this year. It is, however, still 5.2% below
November, 2008 and 19.8% below the recent peak reached in February,
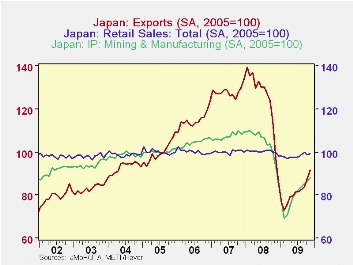
2008. The increase has been fueled primarily by foreign
demand. Exports were up almost 5% in the month of
November. Domestic demand as represented by retail sales, on
the other hand, increased by only 0.2% in November. Retail
sales have shown little growth over the past several years as can be
seem in the first chart that shows industrial production, exports and
retail sales.*
Industrial
production in Japan was reported today to have increased 2.6% in
November to 88.3 (2005=100). This was the ninth month in
which production increased from the low of 69.5 reached in February of
this year. It is, however, still 5.2% below
November, 2008 and 19.8% below the recent peak reached in February,
2008. The increase has been fueled primarily by foreign
demand. Exports were up almost 5% in the month of
November. Domestic demand as represented by retail sales, on
the other hand, increased by only 0.2% in November. Retail
sales have shown little growth over the past several years as can be
seem in the first chart that shows industrial production, exports and
retail sales.*
 The outlook for increased
foreign demand
remains favorable in spite of the high yen. In particular, demand from
China, Japan's largest export customer, is rising together with demand
from other Asian countries. The outlook for domestic demand
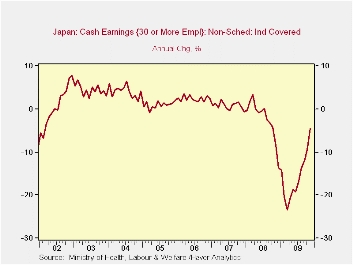
is more problematic. Also released today was the year over
year change in cash earnings in industries employing 30 or more
persons. This series, shown in the second chart, is a good indicator of
general employment conditions and hence an
important indicator of domestic demand. Cash earnings in
November were 4.5% below a year ago. This is an improvement
over October's 9.5% shortfall and the -23.4% of March, 2009 but it is
unlikely to mean a significant increase in domestic demand in the
immediate future. *In the first chart the data for
industrial production and retail sales are seasonally adjusted and
indexed to a 2005 base. In order to have a comparable series
for exports, we used the series for exports seasonally adjusted by the
Ministry of Finance (VEATTLA@JAPAN)
and indexed these data to a 2005 base using the specialized function in
DLX.
The outlook for increased
foreign demand
remains favorable in spite of the high yen. In particular, demand from
China, Japan's largest export customer, is rising together with demand
from other Asian countries. The outlook for domestic demand
is more problematic. Also released today was the year over
year change in cash earnings in industries employing 30 or more
persons. This series, shown in the second chart, is a good indicator of
general employment conditions and hence an
important indicator of domestic demand. Cash earnings in
November were 4.5% below a year ago. This is an improvement
over October's 9.5% shortfall and the -23.4% of March, 2009 but it is
unlikely to mean a significant increase in domestic demand in the
immediate future. *In the first chart the data for
industrial production and retail sales are seasonally adjusted and
indexed to a 2005 base. In order to have a comparable series
for exports, we used the series for exports seasonally adjusted by the
Ministry of Finance (VEATTLA@JAPAN)
and indexed these data to a 2005 base using the specialized function in
DLX.
| JAPAN | Nov 09 | Oct 09 | Sep 09 | M/M% Chg | Y/Y% Chg | 2008 | 2007 | 2006 |
|---|---|---|---|---|---|---|---|---|
| Industrial Production (SA, 2005=100) | 88.3 | 86.1 | 93.1 | 2.56 | -5.16 | 103.8 | 107.4 | 104.3 |
| Retail Sales (SA, 2005=100) | 99.2 | 99.0 | 99.9 | 0.20 | -0.70 | 100.2 | 100.1 | 100.2 |
| Exports (SA, 2005=100) | 91.7 | 87.4 | 97.1 | 4.89 | -5.57 | 123.6 | 128.1 | 114.8 |
| M/M Pt Chg | ||||||||
| Y/Y change in Cash Earnings (%) | -4.5 | -9.4 | -8.5 | 4.9 | 4.0 | -2.4 | 0.8 | 2.4 |
More Economy in Brief
 Global| Feb 05 2026
Charts of the Week: Balanced Policy, Resilient Data and AI Narratives
by:Andrew Cates