 Global| Oct 17 2005
Rising Producer and Wholesale Price Indexes: A Prelude to Rising Consumer Price Indexes?
Summary
Among industrial countries the rise in inflation as measured by the year over year increase in the consumer price index has, to date, been relatively well contained in spite of the rise in energy costs. Inflation at the wholesale and [...]

Among industrial countries the rise in inflation as measured by the year over year increase in the consumer price index has, to date, been relatively well contained in spite of the rise in energy costs. Inflation at the wholesale and producer levels where the impact of higher energy costs are more directly felt has, however, begun to accelerate. If past relationships hold, the pace of consumer price inflation should begin to step up.
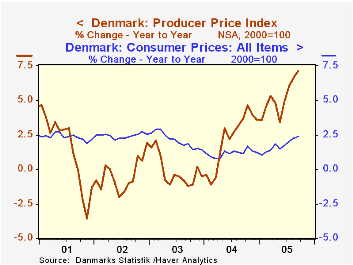
Denmark and Finland , two countries reporting wholesale and producer price indexes today are illustrative of these trends. Most countries no longer distinguish between wholesale and producer price indexes, publishing only the producer price index, but these countries still publish both indexes. The composition of the indexes are not strictly comparable. In September, the Danish index of fuel and oil in the wholesale index rose 47.32% over September, 2004 the wholesale index was up 5.32%, the producer price index, 7.12% and the consumer price index, 2.39%. The first chart shows the year over year increases in the producer price and the consumer price indexes for Denmark. 
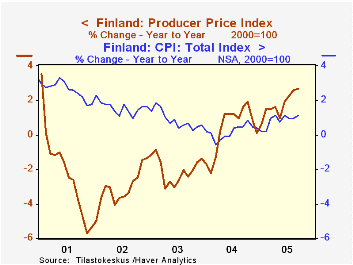
The September Finnish index of energy costs was 15.50% above the index of September, 2004. The wholesale price index was up 3.83%, the producer price index, 2.67% and the consumer price index, 1.14% The second chart shows the year over year increases in the producer price and consumer price indexes for Finland. 
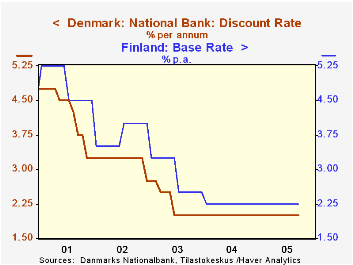
Inflation in Finland has been lower than that in Denmark since late 2001. One factor accounting for the difference could be different monetary policies in the two countries. As a member of the Euro Zone, Finland has been subject to a somewhat tighter monetary policy than that in Denmark, which is outside the Euro Zone. The third chart shows the official base rates in the two countries as an indicator of monetary policy. Since late 2001, the base rate in Finland has been above that in Denmark.
| Price Indexes (2000=100) | Sep 05 | Aug 05 | Sep 04 | M/M % | Y/Y % | 2004 % | 2003 % | 2002 % |
|---|---|---|---|---|---|---|---|---|
| Denmark | ||||||||
| Fuel and Oil Prices (PPI) | 165.8 | 157.9 | 116.5 | 5.04 | 42.33 | 107.8 | 92.9 | 89.3 |
| Producer Price Index | 111.3 | 110.5 | 103.9 | 0.72 | 7.12 | 103.0 | 100.8 | 101.0 |
| Wholesale Price Index | 110.9 | 110.3 | 105.3 | 0.54 | 5.32 | 104.5 | 102.3 | 102.1 |
| Consumer Price Index | 111.2 | 110.3 | 108.6 | 0.82 | 2.39 | 108.3 | 107.0 | 104.8 |
| Finland | ||||||||
| Energy Costs (WPI) | 136.4 | 134.6 | 118.1 | 1.34 | 15.50 | 113.9 | 107.5 | 101.1 |
| Producer Price Index | 96.1 | 65.6 | 63.6 | 0.52 | 2.67 | 93.1 | 92.8 | 94.7 |
| Wholesale Price Index | 102.9 | 102.7 | 99.1 | 0.19 | 3.83 | 98.3 | 97.4 | 97.7 |
| Consumer Price Index | 106.9 | 106.3 | 105.7 | .0.56 | 1.14 | 105.3 | 105.1 | 104.2 |
More Economy in Brief
 Global| Feb 05 2026
Charts of the Week: Balanced Policy, Resilient Data and AI Narratives
by:Andrew Cates


