 Global| Feb 22 2005
Russia Chalks Up Another 7+% Real Growth in 2004: Inflation Accelerates
Summary
Data released today show that Russian Gross Domestic Product rose 7.14% in real terms in 2004, marginally less than the 7.35% rise in 2003. Growth in consumption accelerated to a 9.20% increase from a 6.24% rise in 2003. Imports, [...]

Data released today show that Russian Gross Domestic Product rose 7.14% in real terms in 2004, marginally less than the 7.35% rise in 2003.
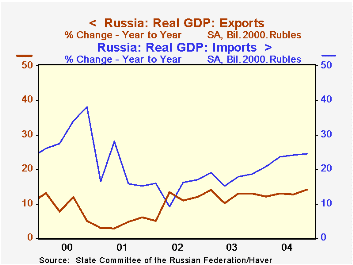
Growth in consumption accelerated to a 9.20% increase from a 6.24% rise in 2003. Imports, perhaps in part at least, due to the rise in consumption, rose sharply. They were up 23.92 % from the 17.66% rise in 2003. The 13.14% rise in exports in 2004 was little changed from the 12.47% of 2003. The year to year growth in exports and imports is shown in the first chart. The growth in Gross fixed investment was 10.83% last year compared to 12.47% in the previous year. Inventory accumulation was a positive, if relatively small, factor in the rise of GDP. Total GDP for the year amounted to 16,779 billion rubles or $535.billion. Per capita GDP in dollar terms was a little more than $4000 in 2004.
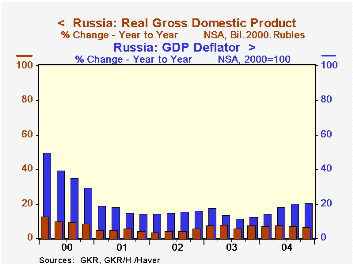
Although inflation has come down from extremely high levels of 2000, it continues to be high. The GDP deflator rose 18.64% in 2004, up from 13.67% in 2003. The second chart shows the rate of increase in real GDP and in the GDP deflator.
| GDP (Bil. 2000 Rubles) | Q4 04 | Q3 04 | Q4 03 | Q/Q % | Y/Y % |
2004 | 2003 | 2002 | 2001 |
|---|---|---|---|---|---|---|---|---|---|
| Gross Domestic Product | 2371.8 | 2307.2 | 2224.9 | 2.80 | 9.60 | 7.14 | 7.35 | 4.74 | 5.09 |
| Consumption | 1541.5 | 1498.6 | 1402.9 | 2.86 | 9.88 | 9.20 | 6.24 | 7.02 | 6.83 |
| Household | 1225.3 | 1184.3 | 1093.0 | 3.46 | 12.10 | 11.26 | 7.51 | 8.50 | 9.50 |
| Government | 295.6 | 294.2 | 289.2 | 0.48 | 5.21 | 2.35 | 2.47 | 2.60 | -0.78 |
| Non Profit Institutions Serving Households | 20.6 | 20.1 | 20.7 | 2.49 | -0.48 | -0.49 | 1.11 | 0.74 | 1.90 |
| Gross Capital Formation | 448.3 | 435.2 | 414.9 | 2.99 | 8.05 | 10.83 | 12.94 | 2.78 | 10.25 |
| Inventory Change | 91.9 | 36.3 | 76.6 | 55.6* | 15.3* | 73.9* | 26.1* | -79.5* | 102.3* |
| Net Exports | 291.7 | 292.0 | 324.5 | -0.3* | -32.8* | -125.9* | 39.8* | 10.4* | -192.9* |
| Exports | 1237.0 | 1185.8 | 1080.0 | 3.90 | 14.07 | 13.14 | 12.47 | 10.26 | 4.22 |
| Imports | 940.3 | 893.8 | 755.5 | 5.20 | 24.46 | 23.92 | 17.66 | 14.58 | 18.72 |
| Deflator (2000=100) | 194.6 | 180.33 | 161.03 | 7.9 | 20.86 | 18.64 | 13.67 | 15.47 | 19.49 |


