 Global| Nov 06 2006
Sales and New Orders and NTC's PMI Suggest Manufacturing in Germany Is Decelerating
Summary
September manufacturing sales and new orders for Germany were released today. Sales increased 0.17% from August but were almost 6% above September, 2005. New orders, however, fell 2.5% in September, although they were 9.6% above a [...]

September manufacturing sales and new orders for Germany were released today. Sales increased 0.17% from August but were almost 6% above September, 2005. New orders, however, fell 2.5% in September, although they were 9.6% above a year ago. The decline in new orders was attributable to foreign orders which declined 6.2% in the month. Domestic order actually increased 1.5%. Both sales and new orders--domestic and foreign--are well above year ago levels.
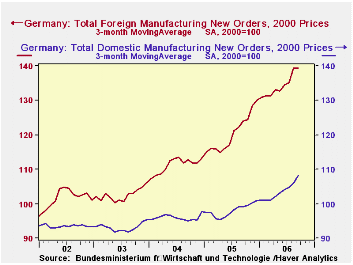
New orders tend to be erratic, as a result, a change in one month's orders may not be indicative. If we take a three month moving average of the data, a smoother picture emerges. The first chart compares the actual new orders with the three month moving average. The three month moving average in September shows a 1.1% gain over the August value. In the second chart, which shows domestic and foreign new orders on a three month moving average basis, foreign new orders are virtually unchanged in September and domestic orders are somewhat better.
The NTC Economics Ltd's Purchasing Managers' Survey for manufacturing in German is suggesting some cooling. The diffusion indexes continue well above the 50 mark, that is indicative of increased activity, but in several indices, the October values are below the September values. The overall index for manufacturing is 58.32 for October, compared to 58.54 in September. Comparable data for the new orders index are 59.84 and 60.09; for export new orders, 56.26 and 57.09 respectively.
Deceleration in growth is not unusual after the good expansion Germany manufacturing has experienced since the beginning of 2005.
| Germany | Sep 06 | Aug 06 | Sep 05 | M/M % | Y/Y % | 2005 % | 2004 % | 2003 % |
|---|---|---|---|---|---|---|---|---|
| Manufacturing (2000=100) | ||||||||
| Sales | 115.1 | 114.9 | 108.6 | 0.17 | 5.99 | 3.27 | 3.92 | -0.48 |
| New Orders | 121.5 | 124.6 | 110.5 | -2.43 | 9.56 | 5.27 | 5.56 | 0.59 |
| Domestic | 110.3 | 108.7 | 99.5 | 1.47 | 10.85 | 2.01 | 3.11 | -0.12 |
| Foreign | 135.6 | 144.4 | 125.2 | -6.23 | 8.15 | 8.80 | 8.29 | 1.94 |
| 3 Month Moving Averages | ||||||||
| Total New Orders | 122.1 | 120.8 | 110.1 | 1.08 | 10.90 | -- | -- | -- |
| Domestic | 108.1 | 106.0 | 100.9 | 1.98 | 7.14 | -- | -- | -- |
| Foreign | 139.5 | 139.3 | 123.9 | 0.14 | 12.59 | -- | -- | -- |
More Economy in Brief
 Global| Feb 05 2026
Charts of the Week: Balanced Policy, Resilient Data and AI Narratives
by:Andrew Cates


