 Global| Nov 05 2007
Signs of Cooling in the British Economy
Summary
Industrial production in the United Kingdom declined 0.50% in September to 99.1 (2003=100) from 99.6 in August and was 0.30% below September, 2006. Energy, which has been in a down trend for the past three years was the only major [...]


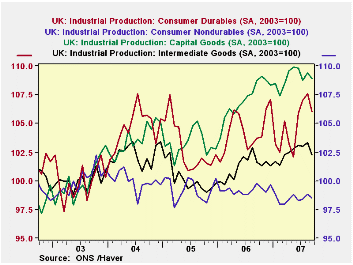
Industrial production in the United Kingdom declined 0.50% in September to 99.1 (2003=100) from 99.6 in August and was 0.30% below September, 2006. Energy, which has been in a down trend for the past three years was the only major sector to increase. The production of consumer non durable and durable goods, capital goods and intermediate goods were all down, as can be seen in the first chart.
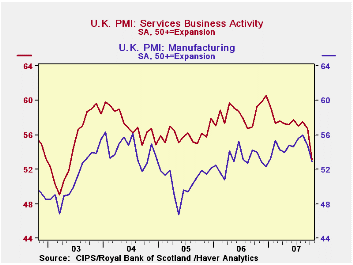
The Purchasing Managers Index of manufacturing activity for October, published last week suggests continued weakness in the manufacturing sector. The index, while still in the expansion phase (above 50), declined 3.25% from September to 52.4% in October.
Much more important, the October Purchasing Managers Index for services was released today. Services account for almost 75% of the Gross Domestic Product, while manufacturing accounts for about 15%. The service index showed a decline, almost twice as large as that of the manufacturing sector--6.37%--to 53.08%. The two PMI's are shown in the second chart.
| INDUSTRIAL PRODUCTION 2003=100 | Sep 07 | Aug 07 | Sep 06 | M/M Chg | Y/Y Chg | 2006 | 2005 | 2004 |
|---|---|---|---|---|---|---|---|---|
| Industrial Production | 99.1 | 99.6 | 99.4 | -0.50 | -0.30 | 98.8 | 98.8 | 100.8 |
| Consumer Durables | 106.0 | 107.6 | 103.7 | -1.49 | 2.22 | 104.3 | 102.9 | 104.1 |
| Consumer Nondurables | 98.5 | 98.8 | 99.8 | -0.30 | -1.30 | 99.2 | 99.2 | 100.0 |
| Capital Goods | 108.9 | 109.4 | 108.7 | -0.46 | 0.18 | 107.1 | 103.2 | 103.6 |
| Intermediate Goods | 102.2 | 103.3 | 101.6 | -1.06 | 0.59 | 101.2 | 100.1 | 102.3 |
| Energy | 85.2 | 84.6 | 85.9 | 0.71 | -0.81 | 86.2 | 91.5 | 96.4 |


