 Global| Oct 17 2011
Singapore: Advanced Q3 GDP Up 5.9% Y/Y
Summary
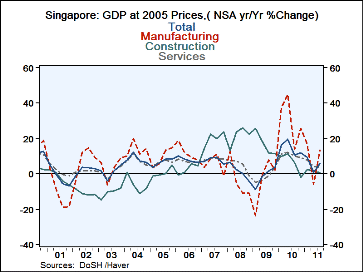
Singapore, the City State of some 5.2 million people, announced its advanced estimate of a 5.9% increase in third quarter year on year growth in real GDP, a significant rise from the 1% of the second quarter. The advanced estimates [...]
Singapore, the City State of some 5.2 million people, announced its advanced estimate of a 5.9% increase in third quarter year on year growth in real GDP, a significant rise from the 1% of the second quarter. The advanced estimates are based on data for the first two months of the quarter. Manufacturing activity in the third quarter is estimated to have increased a healthy 13.2% from the third quarter of last year more than making up for the second quarter decline of 5.8%. Construction activity is estimated to have increased only 0.4% in the third quarter down from a 1.5% increase in the second quarter. Similarly, activity in the service industries decelerated in the third quarter to an increase of 3.6% from 4.0% in the second quarter. Data on the year to year changes in total GDP and in the Manufacturing, Construction and Service sectors are shown in the first chart. The Ministry of Trade and Industry, responsible for these estimates, expects real GDP for the whole year to increase by 5.0%. Preliminary GDP estimates based on data for the three months of the quarter will be released in November.
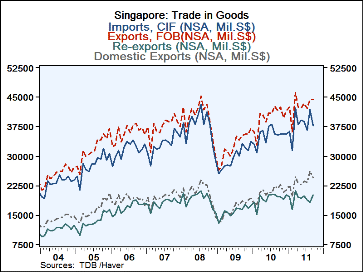
Data on Singapore's trade in goods through September have also been released recently. Singapore serves as an entrepot for some of its neighboring countries, that is, it imports products from these countries and re exports them with little or no processing of the products. Countries ship through an entrepot because of the superior trading connections of the entrepot. Total Exports, Domestic Exports, Re-exports and Total Imports are shown in the second chart. The total balance of trade for recent months is shown in the table below. The importance of the entrepot trade to Singapore can be seen in the table below and in the chart. Re-exports are almost half of total exports.
| Y/Y % Change | Q3 11 | Q2 11 | Q1 11 | Q4 10 | Q3 10 | Q2 10 | Q1 10 |
|---|---|---|---|---|---|---|---|
| Real GDP | 5.9 | 1.0 | 9.3 | 12.0 | 10.5 | 19.4 | 16.4 |
| Manufacturing | 13.2 | -5.8 | 16.5 | 25.5 | 13.7 | 45.2 | 37.2 |
| Construction | 0.4 | 1.5 | 2.4 | -2.0 | 6.7 | 11.4 | 9.7 |
| Services | 3.6 | 4.0 | 7.6 | 8.8 | 10.2 | 12.1 | 11.1 |
| Trade in Goods (Bil. S$) | Sep 11 | Aug 11 | Jul 11 | Jun 11 | May 11 | Apr 11 | Mar 11 |
| Exports | 44.5 | 44.4 | 42.1 | 43.4 | 42.3 | 42.5 | 46.0 |
| Domestic Exports | 24.5 | 26.3 | 23.3 | 23.5 | 22.9 | 23.0 | 24.9 |
| Re-exports | 20.0 | 18.2 | 18.8 | 19.9 | 19.4 | 19.6 | 21.8 |
| Imports | 37.8 | 41.8 | 36.6 | 38.4 | 39.3 | 38.1 | 42.3 |
| Balance | 6.7 | 2.7 | 5.6 | 4.6 | 3.0 | 4.4 | 3.7 |
More Economy in Brief
 Global| Feb 05 2026
Charts of the Week: Balanced Policy, Resilient Data and AI Narratives
by:Andrew Cates


