 Global| Oct 18 2010
Singapore Trade In Strong Recovery
Summary
The small island of Singapore--an area of some 263 square miles and a population of just over 5 million people--has one of the highest per capita GDPs in Asia. In 2009, per capita GDP was $36,537. Foreign trade is the source of much [...]
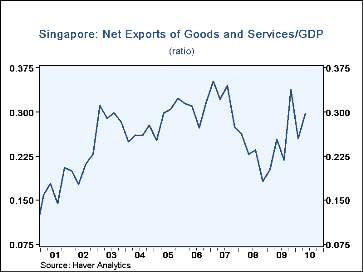
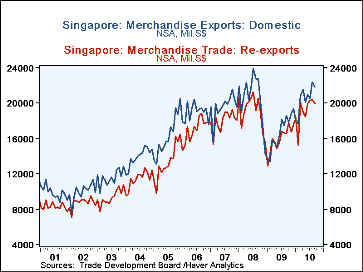
The small island of Singapore--an area of some 263 square miles and a population of just over 5 million people--has one of the highest per capita GDPs in Asia. In 2009, per capita GDP was $36,537. Foreign trade is the source of much of its wealth. As the first chart shows net exports of goods and services have averaged about 25% of GDP over the past ten years. Not only has Singapore a thriving export and import trade, but it also has a large entrepot trade. In 2009, Singapore's domestic exports were S$20 billion, while re-exports were almost equal at S$19 billion.
The data released today show that total exports declined 2.3% from S$42.7billion in August to S$41.7 billion in September. Domestic exports were down 2.5% and re-exports, 2.1%. Imports declined 1.0% from S$35.8 billion in from August to S$35.4 billion in September. The balance on trade fell from S$7 billion in August to S$6.3 billion in September. Too much significance should not be attributed to the September decline. The data show considerable volatility month to month, but, more importantly, they also show a strong upward trend from the low point of January 2009.
| Singapore(NSA, BIL S$) | Sep 10 | Aug 10 | Sep 09 | M/M % | Y/Y % | 2009 | 2008 | 2007 |
|---|---|---|---|---|---|---|---|---|
| Exports | 41.7 | 42.7 | 35.1 | -2.30 | 18.84 | 391.1 | 476.8 | 450.6 |
| Domestic | 21.8 | 22.4 | 18.6 | -2.51 | 17.25 | 200.0 | 247.7 | 234.9 |
| Re-Exports | 19.9 | 20.4 | 16.5 | -2.08 | 20.63 | 191.1 | 229.1 | 215.7 |
| Imports | 35.4 | 35.8 | 33.1 | -1.04 | 6.87 | 356.3 | 450.9 | 396.0 |
| Balance | 6.3 | 7.0 | 2.0 | -0.7* | 4.3* | 34.8 | 25.8 | 54.6 |
| Q2 10 | Q1 10 | Q2 09 | Q/Q Chg | Y/Y Chg | 2009 | 2008 | 2007 | |
| Net Exports of Goods & Services | 21.7 | 17.6 | 15.6 | 4.1 | 6.1 | 627.1 | 570.0 | 793.8 |
| Real GDP | 73.2 | 69.4 | 61.6 | 3.8 | 11.6 | 2474.6 | 2507.7 | 2460.7 |
| * M/M and Y/Y change | ||||||||


