 Global| Mar 06 2012
Slight Improvement In Manufacturing In The Euro-Area In February
Summary
Purchasing Managers from manufacturing firms in the Euro Area were, on balance. slightly more pessimistic in February than they were in January. For the Euro Area as a whole, the index was 50.33, down from 50.42 in January, still in [...]
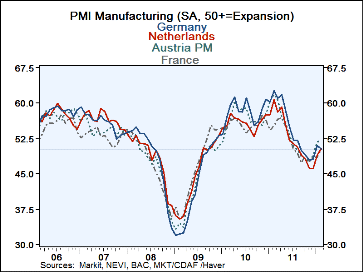
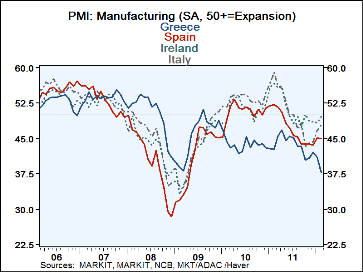
Purchasing Managers from manufacturing firms in the Euro Area were, on balance. slightly more pessimistic in February than they were in January. For the Euro Area as a whole, the index was 50.33, down from 50.42 in January, still in the expansion zone of the cycle, though just barely. The indexes for Austria, the Netherlands and France all rose in February, strengthening their positions in the expansion zone. The indexes for Ireland and Italy also improved: the former from 48.26 to 49.72 and the latter from 46.78 to 47.83, but manufacturing in these countries was still in the contraction phase of the cycle. Increases in the indexes were offset by a slight decline in Germany from 51.02 to 50.22, and more substantial declines in Spain and Greece. The indexes for Spain declined from 45.08 to 45.00 and Greece from 40.97 to 37.67, both continuing well into the contraction zone. The first chart shows the indexes for Germany, the Netherlands, Austria and France. The second charts shows the indexes for Spain, Greece, Ireland and Italy.
The MARKIT ECONOMICS. LTD data base includes purchasing managers' diffusion indexes for manufacturing, services and composite business activity. Composite activity indexes are available for the Euro Area, France, Germany, Italy, Spain, Ireland, China, India, Russia, Brazil, Japan, Hong Kong, United Arab Republic and Saudi Arabia. In addition, manufacturing indexes are available for Canada, Czech Republic, Denmark, Austria, Greece, the Netherlands, Israel, Hong Kong, Korea, New Zealand, Poland, Singapore, South Africa, Switzerland, Taiwan, Turkey and the United States. The manufacturing index for the Euro Area is based on activity in eight countries--France, Germany, Italy, Spain. Ireland, Austria and the Netherlands--which comprise roughly 90% of the manufacturing activity in the Euro Area.
| PMI Composite | Feb-12 | Jan-12 | PMI Manufacturing | Feb-12 | Jan-12 |
|---|---|---|---|---|---|
| China | 50.83 | 50.12 | Germany | 50.22 | 51.02 |
| India | 54.94 | 55.41 | Netherlands | 50.33 | 49.90 |
| Russia | 53.67 | 54.39 | Austria | 51.96 | 51.75 |
| Brazil | 53.77 | 52.34 | France | 50.20 | 48.50 |
| France | 50.22 | 51.23 | Greece | 37.67 | 40.97 |
| Spain | 42.89 | 46.05 | Spain | 44.96 | 45.08 |
| Ireland | 52.27 | 47.92 | Ireland | 49.72 | 48.26 |
| Italy | 44.69 | 45.69 | Italy | 47.83 | 46.78 |
| Germany | 51.27 | 51.28 | |||
| Japan | 51.23 | 51.14 | -- | ||
| UK | 53.55 | 55.92 | -- | ||
| Hong Kong | 52.75 | 51.92 | -- | ||


