 Global| Mar 27 2012
Some Consumer Surveys Are Hinting At A Rise In Propensity To Consume
Summary
A number of surveys relating to consumer confidence were released today. Consumers in Finland, France and Germany in Europe and in Korea in Asia showed some signs of increasing their propensities to consume in March. The latest data [...]
 A number of surveys relating to consumer confidence were released
today. Consumers in Finland, France and Germany in Europe and in
Korea in Asia showed some signs of increasing their propensities to
consume in March. The latest data for the Swiss UBS consumption indicator
is February and the indication has declined for the second
month.
From Finland there was a survey of consumer buying intentions Over the next 6 months, the Finnish Consumer is more likely to buy& house furnishing, sports equipment, non car vehicles and trips both around Finland and abroad than in to spend money on repairing a house or buying a car or appliances.
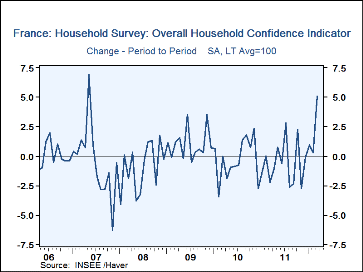
In France, INSEE's Survey of Consumer Confidence showed the largest month-to-month increase in its household confidence indicator since May 2007, as can be seen in the first chart.
In Germany, the GfK survey of the consumer climate showed a one point improvement in March largely due to a perceived improvement in the economic situation. More German consumers saw their incomes declining than increasing in March and were reluctant to increase their spending. GfK estimates April will show a one point decline in their measure of the consumer climate. The GfK findings are somewhat at odds with the IFO data released yesterday that showed a sharp jump -5.9-percentage points in the percent balance on the business climate in Retail Trade.
In Korea, the Composite Sentiment Indicator increased to 101 from 100 in February, just a bit better than its neutral value of 100.
| France INSEE | Apr'12 | Mar'12 | Feb'12 | Jan'12 |
|---|---|---|---|---|
| Germany GfK | 5.9 | 6.0 | 5.9 | |
| Switzerland UBS Consumption Indicator | N/A | .872 | .926 | |
| Korea Composite Consumer Sentiment Indicator | 101 | 100 | ||
| Finland Propensity to Consume in 6 Months (%) | ||||
| House Repair | 36.2 | 36.8 | ||
| Furnishings | 39.9 | 39.4 | ||
| Vacation Residence | 2.3 | 2.4 | ||
| Electronics | 31.3 | 33.1 | ||
| Appliances | 18.4 | 18.5 | ||
| Sports Equipment | 21.2 | 18.2 | ||
| Non Car Vehicle | 15.0 | 11.4 | ||
| Trip in Finland | 59.0 | 55.6 | ||
| Trip Abroad | 49.9 | 49.3 | ||
More Economy in Brief
 Global| Feb 05 2026
Charts of the Week: Balanced Policy, Resilient Data and AI Narratives
by:Andrew Cates


