 Global| Jul 24 2006
South Korea Trade in Goods: Small Deficit in Won Terms in June, Terms of Trade Continue Unfavorable
Summary
Earlier this month South Korea reported a seasonally adjusted deficit on foreign trade of 1.94 billion won in June compared with a surplus of 1,505 billion won in May. This was the first deficit since March, 2003 and was the result of [...]
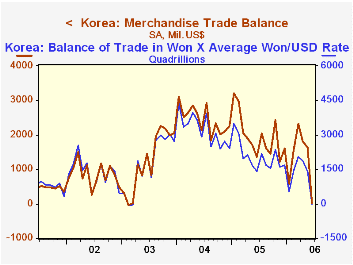
Earlier this month South Korea reported a seasonally adjusted deficit on foreign trade of 1.94 billion won in June compared with a surplus of 1,505 billion won in May. This was the first deficit since March, 2003 and was the result of a decline of 817 billion won in exports and an increase of 816 billion won in imports. Incidentally, in US dollar terms, there was a surplus of $3.78 million. This illustrates the point that one can't simply multiply the won value by the Won/Dollar rate to determine the value of the balance of trade in dollars. The correct procedure is first, to convert the won exports and imports into dollars and then the difference between the two is computed. In determining the dollar value of individual exports and imports, different exchange rates may be used depending on the timing of the exports or the imports. The difference between applying an average exchange rate to the won balance of trade and the more involved procedure is not great, but enough to turn a small deficit in won into a small surplus in dollars. In the first chart we show Korea's balance of trade in USD as reported by the Bank of Korea and the balance of trade computed by multiplying the Won value by the average exchange rate.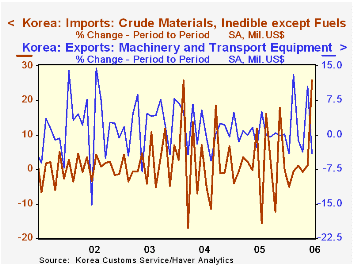
Details of the composition of exports and imports and export and import prices for June were released today. Trade by country for June is yet to be published. The biggest increase among imports of commodities was crude material including inedible, ex fuel, which increased 351 billion Won in June. Surprisingly, the category including fuel, which has seen dramatic price increases, declined 45 billion Won in June but this decline followed a peak increase of 1,724 billion Won in May. The biggest decline among exports was in machinery and transport, which declined 705 billion Won in June. The month to month changes in the import of crude material including inedible, ex fuel and the export of machinery and transport are shown in the second chart.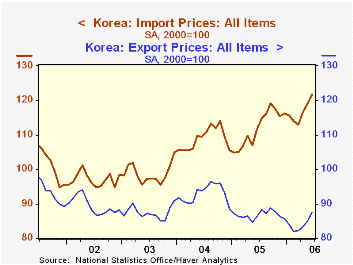
Since mid 2005, the spread between import and export prices, shown in the third chart, has been widening, with import prices rising, while export prices have tended to decline. As a result, the terms of trade for Korea have worsened steadily.
| South Korea | Jun 06 | May 06 | Jun 05 | M/M Dif | Y/Y Dif | 2005 | 2004 | 2003 |
|---|---|---|---|---|---|---|---|---|
| Exports (Bil Won) | 25810 | 26626 | 26753 | -816 | 2057 | 291579 | 290419 | 230914 |
| Imports (Bil Won) | 25911 | 25123 | 23752 | 688 | 3489 | 267443 | 256741 | 213175 |
| Balance (Bil Won) | -1.94 | 1503.25 | 1399.90 | -1505.18 | -1401.94 | 24135 | 33678 | 17739 |
| Exports (Mil USD) | 26953 | 28279 | 23369 | -1326 | 3584 | 284617 | 253845 | 193817 |
| Imports (Mil USD) | 26950 | 26646 | 21998 | 304 | 4952 | 261091 | 224462 | 178827 |
| Balance (Mil USD) | 3.78 | 1634 | 1372 | -1630 | -1368 | 23526 | 29392 | 14990 |
| Import: Crude Material, inedible ex fuels (Mil USD) | 1718 | 1368 | 1377 | 350.97 | 341.44 | 15354 | 13535 | 10147 |
| Export: Machinery & Transport (Mil USD) | 16085 | 16790 | 14024 | -705.10 | 2060.81 | 173492 | 159994 | 121142 |
| Terms of Trade (2000=100) | 71.85 | 71.50 | 72.43 | 0.49* | -7.21* | 77.56 | 85.34 | 88.85 |
| Export Prices (2000=100) | 87.45 | 85.16 | 86.32 | 2.69* | 1.61* | 86.74 | 92.93 | 87.51 |
| Import Prices (2000=100 | 121.72 | 119.10 | 111.48 | 2.20* | 9.19* | 112.03 | 108.89 | 98.85 |


