 Global| Nov 05 2019
Stable U.S. Oil and Gasoline Prices; Colder Weather Drives Natural Gas Higher
Summary
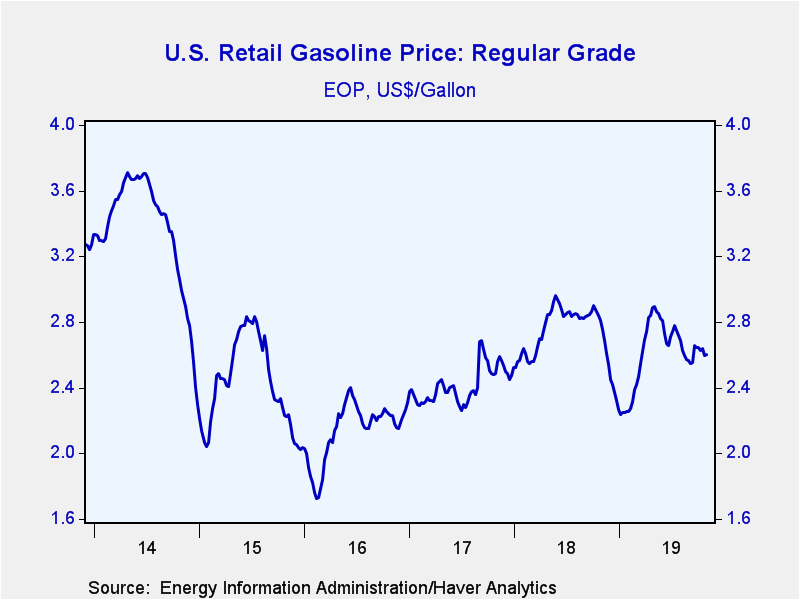
Retail gasoline prices ticked up to $2.61 per gallon last week (-5.4% year-on-year) from $2.60 in the previous week, Gasoline prices have been range-bound since early August. Haver Analytics constructs factors adjusting for the [...]
Retail gasoline prices ticked up to $2.61 per gallon last week (-5.4% year-on-year) from $2.60 in the previous week, Gasoline prices have been range-bound since early August. Haver Analytics constructs factors adjusting for the seasonal variation in gasoline pump prices. The seasonally-adjusted price edged up to $2.57 per gallon and has also been relatively stable for the last few months.
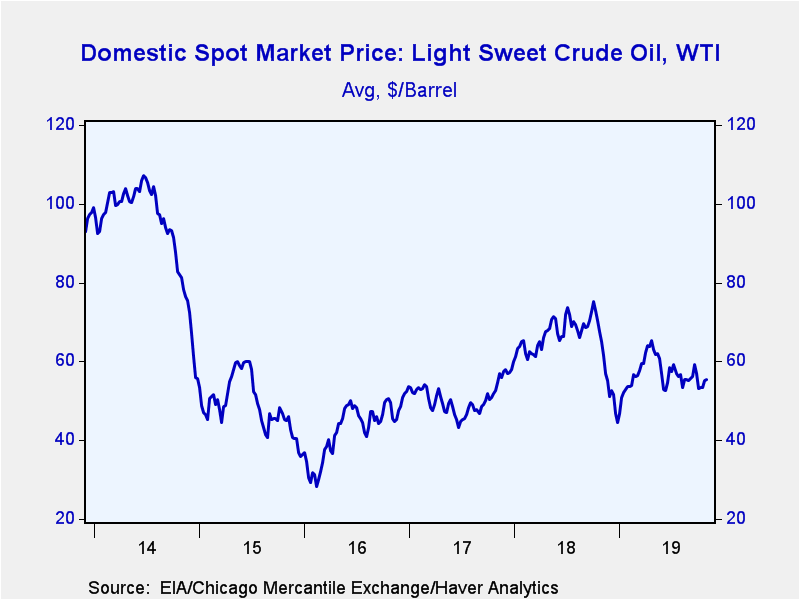
West Texas Intermediate crude oil prices averaged $55.28 (-15.0% y/y) per barrel last week. Oil prices have been in the $50-to-$60 range since June. Yesterday, prices were $56.54. Brent crude oil prices averaged of $60.85 per barrel last week and were $62.10 yesterday.
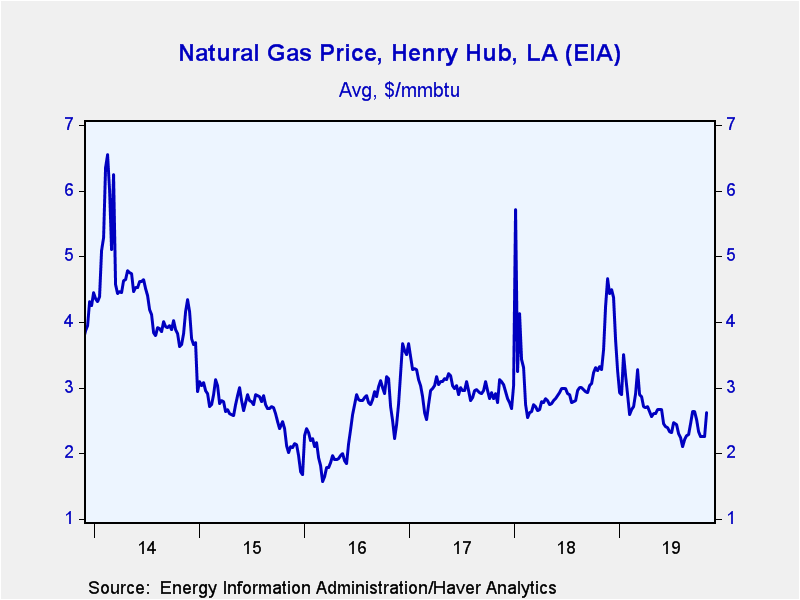
Natural gas prices jumped to $2.62/mmbtu last week (-20.1% y/y), likely the result of a 10 degree Fahrenheit drop in U.S. temperatures.
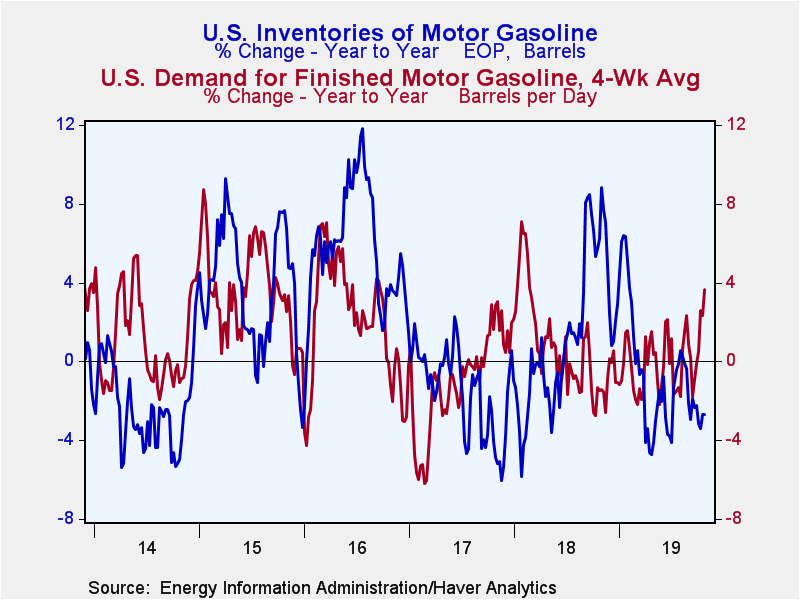
In the four-weeks ending October 25, gasoline demand increased 3.6% y/y. Total petroleum product demand rose 3.4% y/y. Gasoline inventories decreased 2.7% y/y in the week ending October 25, while inventories of all petroleum products grew 0.7% y/y. Crude oil input to refineries fell 3.5% y/y in the last four weeks.
These data are reported by the U.S. Department of Energy and the National Climate Data Center. The price data can be found in Haver's WEEKLY and DAILY databases. Weekly U.S. National (Contiguous 48 States) temperature can be found in WEEKLY. Greater detail on prices, as well as the demand, production and inventory data, along with regional breakdowns, are in OILWKLY.
| Weekly Energy Prices | 11/04/19 | 10/28/19 | 10/21/19 | Y/Y % | 2018 | 2017 | 2016 |
|---|---|---|---|---|---|---|---|
| Retail Gasoline ($ per Gallon Regular, Monday Price, End of Period) | 2.61 | 2.60 | 2.64 | -5.4 | 2.27 | 2.47 | 2.31 |
| Light Sweet Crude Oil, WTI ($ per bbl, Previous Week's Average) | 55.28 | 55.24 | 53.48 | -15.0 | 64.95 | 50.87 | 43.22 |
| Natural Gas ($/mmbtu, LA, Previous Week's Average) | 2.62 | 2.25 | 2.25 | -20.1 | 3.18 | 2.99 | 2.51 |
Gerald D. Cohen
AuthorMore in Author Profile »Gerald Cohen provides strategic vision and leadership of the translational economic research and policy initiatives at the Kenan Institute of Private Enterprise.
He has worked in both the public and private sectors focusing on the intersection between financial markets and economic fundamentals. He was a Senior Economist at Haver Analytics from January 2019 to February 2021. During the Obama Administration Gerald was Deputy Assistant Secretary for Macroeconomic Analysis at the U.S. Department of Treasury where he helped formulate and evaluate the impact of policy proposals on the U.S. economy. Prior to Treasury, he co-managed a global macro fund at Ziff Brothers Investments.
Gerald holds a bachelor’s of science from the Massachusetts Institute of Technology and a Ph.D. in Economics from Harvard University and is a contributing author to 30-Second Money as well as a co-author of Political Cycles and the Macroeconomy.
More Economy in Brief
 Global| Feb 05 2026
Charts of the Week: Balanced Policy, Resilient Data and AI Narratives
by:Andrew Cates


