 Global| Aug 28 2006
Strong Increases in Wages in Estonia and Lithuania: Improved Confidence in Slovenia and Slovakia
Summary
Estonia and Lithuania reported that average monthly wages in the second quarter were 14.96% and 14.12%, respectively, above the second quarter of 2005. Wage growth in Lithuania has been accelerating and this was the highest year-to- [...]

Estonia and Lithuania reported that average monthly wages in the second quarter were 14.96% and 14.12%, respectively, above the second quarter of 2005. Wage growth in Lithuania has been accelerating and this was the highest year-to-year increase to date. Wage growth in Estonia, on the other hand, had decelerated from 14.63% in the second quarter of 2001 to 7.26% in the second quarter of 2004, since then it has accelerated. The trends of wage growth in the two countries are shown in the first chart. To get some idea of the relative level of wages in the two countries we converted the wages in local currency into wages in euros. There are 15.646 Estonian Kroon in one Euro and 3.452 Lithuanian Litas in one Euro. In terms of euros the average monthly wage level in the second quarter of this year was 440 euros for Lithuania and 609.euros for Estonia.
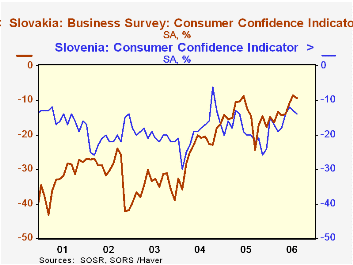
Two other emerging countries of Europe, Slovenia and Slovakia reported the results of recent business surveys. The results are the excess of those who believe conditions will improve over those who believe conditions will worsen. Those participating in Slovakia's Industry Confidence Survey have generally shown an excess of optimists over pessimists, while those participating in Slovenia's Combined Confidence Indicator have had an excess of pessimists until November, 2005. Since then there has been an increasing excess of optimists as can be seen in the second chart. The disparity between the two surveys may be due to the fact that the Combined Confidence Indicator includes the opinions of consumers who until recently have been pessimistic whereas Slovakia's Industry Confidence Survey does not. In the third chart, we have plotted the Slovenia's Combined Confidence Indicator with the Consumer Component. It is clear that the consumer has had a negative effect on the combined index until recently.
| Q2 06 | Q1 06 | Q2 05 | Q/Q % | Y/Y % | 2005 % | 2004 % | 2003 % | |
|---|---|---|---|---|---|---|---|---|
| Monthly Wage NAS | ||||||||
| Estonia (Kroon) | 9531 | 8591 | 8291 | 2.96 | 14.96 | 11.94 | 7.71 | 9.64 |
| Estonia (Euro | 609 | -- | -- | -- | -- | -- | -- | -- |
| Lithuania (Litas) | 1519.7 | 14370 | 1331.5 | 5.76 | 14.13 | 10.02 | 5.71 | 4.41 |
| Lithuania (Euro) | 440 | -- | -- | -- | -- | -- | -- | -- |
| Aug 06 | Jul 06 | Aug 05 | Q/Q Dif | Y/Y Dif | 2005 Dif | 2004 Dif | 2003 Dif | |
| Measures of Confidence | ||||||||
| Slovakia Business Survey % Bal | 10.7 | 9.7 | -1.3 | 1.0 | 12.0 | 4.6 | 6.5 | 4.6 |
| Slovenia Combined Sentiment Indicator % Bal | 6 | 7 | -1 | -1 | 7 | -1 | -1 | -5 |
| Slovenia Consumer | -14 | -13 | -20 | -1 | 6 | -19 | -19 | -20 |
More Economy in Brief
 Global| Feb 05 2026
Charts of the Week: Balanced Policy, Resilient Data and AI Narratives
by:Andrew Cates


