 Global| Nov 12 2018
Swing Lower OECD Chariot...Carrying Me Where?
Summary
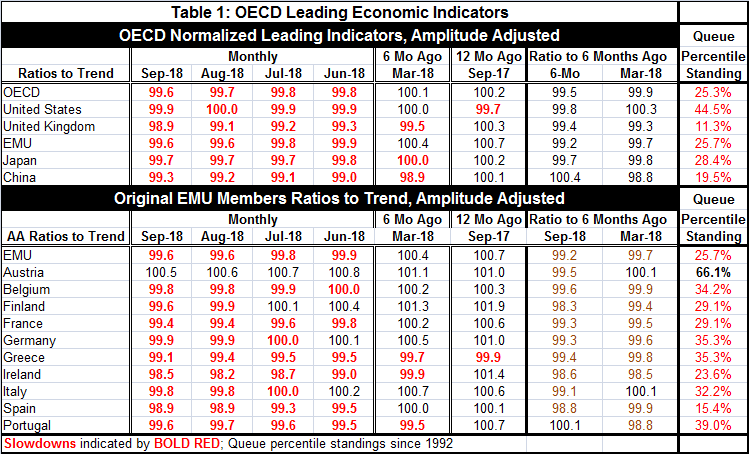
The OECD area shows barely or below normal growth readings (indexes at or below 100) for all countries and regions in the top of Table 1 since June. Six months ago, three countries or regions had readings at or above 100 (the whole of [...]
 The OECD area shows barely or below normal growth readings (indexes at or below 100) for all countries and regions in the top of Table 1 since June. Six months ago, three countries or regions had readings at or above 100 (the whole of the OECD area, the United States and the EMU). Twelve months ago, among top-panel countries and regions, only the U.S. was below 100. Now not only are readings for the past four months at or below 100, but all except China also are showing deceleration compared to six months ago. That means all measures are at or below 100 and all (except China) are weaker than they were six months ago as well. This is a condition also known as weak and getting weaker.
The top panel also contains two columns showing the ratio of current readings to six months ago and also the ratio of the six month ago reading to six months earlier. The six month earlier ratio shows weakening on that timeline for all ratios except for the U.S. So the bulk of the countries and regions in the top panel are weakening from 12 months ago to six months ago and the weakening also from six months ago to now.
While there is a bright side, that is that the current LEI values are generally not much more than one percentage point from the 100 reading which represents normalcy. So despite the breadth of the slowdown, the slowdown so far is relatively shallow across the board.
And the counterpoint to that counterpoint is that despite the apparent shallowness of the swoon, the percentile standings of the level of these indicators still is extremely low when compared to all values back to June 1994. When evaluated against data over the last 24 years, we find that the queue standings still are extremely weak. For every country/region in the top panel of the first table, all queue standings are below their respective medians (below the 50 mark). In fact, the highest reading is from the U.S. at a 44th percentile standing. Unlike the optimism being pedaled in the U.S., the OECD area indexes tell us that the U.S. and the global economy all are slowing down and that LEI reading are infrequently a lot weaker than they are now.
The bottom panel looks at the earliest members of the euro area. There we see all members except Austria with readings at or below 100 in September. Of the 44 monthly observations (11 countries/regions over four months), there are only eight reading above 100 since June 2018. And half of those were in June itself. Six months ago, only three of these EMU members had readings below 100. Twelve months ago, only one (Greece) had a reading below 100. So the ratio of the current September reading to March 2018 is lower in 10 of 11 of these entries (Portugal is the exception). While over the previous six months to that, all countries/regions have shown decay except Austria and Italy.
Ranking the EMU members in the table over the last 24 years produces queue percentile standings below their respective 50th percentile of all entities except Austria. Five of the readings are in their 30th percentile standing clustering around a reading in the 35th percentile. Spain is the relative weakest at a 15th percentile standing. The EMU area as whole has a 25.7 percentile standing- it has been stronger over the last 25 years about 75% of the time.
We have seen this weakness and lack of upward momentum looking at the Markit PMI indexes. The OECD matrix of data which look much more broadly at each country’s data set echoes that same finding. Conditions are sub-par. Momentum is slowing. But there is little guideline about how far this slowing will go. Central bankers are slowdown skeptics as the ECB continues to be in denial about the extent or risk from European slowing. And in the U.S., the Federal Reserve continues to point the way with rate hikes and is egged on by economists on Wall Street to do more because of economic ‘strength.’ For its part, the U.S. yield curve has stopped flattening or at least paused in its flattening.
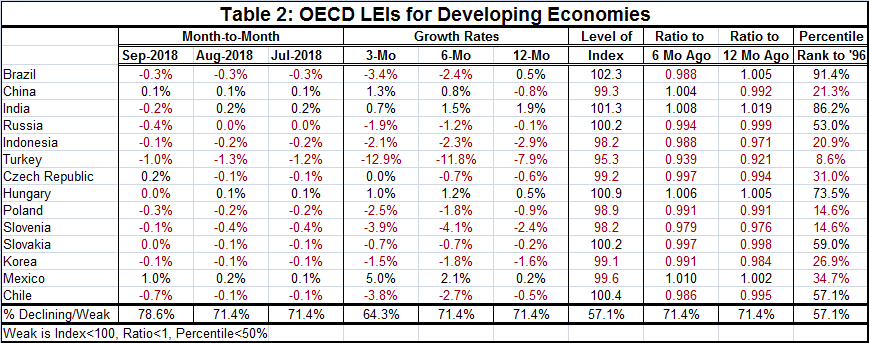
Adding to the sense of malaise are developments in the developing economy area where the slowdown is also quite broad-based.
Of the 14 countries in Table 2, 78.6% show LEI declines in September with 71.4% showing declines in August and in July. The developing economy loss of momentum is widespread. Eight of 14 countries sport LEI readings below 100 in September so nearly half of the countries in the table are still growing about at a normal pace despite the widespread slippage. However, the ratios of these LEIs to values of six months ago are higher in only four of fourteen cases.
Also the ratios of six months ago to levels six months before that are higher in only four cases, marking the slowdowns well entrenched over the last 12 months.
While Brazil shows a slowdown in progress, its LEI standing is in the top 9% of its range of observations back to 1996. India also is relatively strong and with less of a loss in momentum; it has a queue percentile standing only its 86th percentile and its LEI is up on balance over three months, six months and 12 months. Hungary is another exception not as strong with a 73rd percentile queue standing but also with LEI gains over three months, six months and 12 months. Russia, Slovakia and Chile have queue standings around their respective 50 level, marking above median expansions, but all of these have fading momentum. Fifty Seven percent of the LEI readings have queue standings below their respective median values (below 50).
 The Baltic dry goods index of global trade volumes continues to drop sharply although this move is hardly unprecedented. Still, it occurs amid trade tensions, trade war, and the imposition of sanctions on Russia and on Iran and during a period of considerable geopolitical stresses.
Central bankers are poised to raise rates to fight an inflation rate that refuses to emerge. Or maybe they want rates back to normal because of their fear of financial excesses. These risks seem less likely today given the recent behavior of global stocks over the past month; U.S. inflation should be more remote with the dollar rising. Still, we have little to go on given the way that central banks have been making policy. In the U.S., the Fed has only just barely achieved its inflation target after over five consecutive years of missing on the downside. It is a bit hard to understand the Fed’s hair-trigger reaction to inflation that has finally only climbed up to target. In the EMU and Japan, inflation (core) is still below target.
The worry du jour is over Brexit and that is hitting the pound sterling lower and driving the dollar higher- a move that makes inflation in the U.S. even less likely despite pending tariff repercussions.
The world has become a messy place. And while past themes of weakness have faded and to be replaced by growth, growth now seems to have faded and signs of weakness once again are becoming more widespread. However, this is more like garden-variety weakness. This is no longer the weakness in the wake of deep recession that can’t be shaken off…or is it? That’s the problem. We don’t really know. But local unemployment rates are a lot lower and that seem to count for a lot.
When Ben Bernanke was Chair at the Fed, one thing he kept repeating was that in the past the biggest policy mistakes made after a period of abject economic weakness was to try to restore normalcy again too soon. Is that the same old mistake that the Fed and the ECB are getting ready to make again? When central banks fear one kind of mistake, do they make a different one? Central banks right now are worried that they have left policy too easy for too long. What if that judgement is wrong?
The essence of policy making is judgement. If we knew - really knew - what the biggest risk was, policy could act to avoid it. But there is no clarity about that. On balance, we are left with disquieting trends and economic results that are unclear. We have a politically unsettling period with political instabilities in Germany and Italy. The EU Commission is at logger heads with Italy. With Brexit troubles of all sorts are in play and Theresa May might be finding her plan more in even trouble at home. China is playing at the fringes to seem more like Mr. Nice Guy (it isn’t) offering more open trade. And Russia may have been caught with its hand in the cookie jar destabilizing GPS signals while Nordic countries were engaged in come localized exercises (Russia denies it, of course). The world is looking like a more dangerous and less dependable place. Investors are still trying to puzzle out where they want to be. We have not heard any prevarication from policymakers. As usual, they are leading from behind.

Robert Brusca
AuthorMore in Author Profile »Robert A. Brusca is Chief Economist of Fact and Opinion Economics, a consulting firm he founded in Manhattan. He has been an economist on Wall Street for over 25 years. He has visited central banking and large institutional clients in over 30 countries in his career as an economist. Mr. Brusca was a Divisional Research Chief at the Federal Reserve Bank of NY (Chief of the International Financial markets Division), a Fed Watcher at Irving Trust and Chief Economist at Nikko Securities International. He is widely quoted and appears in various media. Mr. Brusca holds an MA and Ph.D. in economics from Michigan State University and a BA in Economics from the University of Michigan. His research pursues his strong interests in non aligned policy economics as well as international economics. FAO Economics’ research targets investors to assist them in making better investment decisions in stocks, bonds and in a variety of international assets. The company does not manage money and has no conflicts in giving economic advice.
More Economy in Brief


