 Global| Jun 10 2020
Taking the Temperature with Non-traditional Data
by:Andrew Cates
|in:Economy in Brief
Summary
Many economists are now looking to non-traditional real-time data sources to get a bearing on the economic temperature. That's partly because of the normal lags that exist between the period to which traditional data sources pertain [...]
Many economists are now looking to non-traditional real-time data sources to get a bearing on the economic temperature. That's partly because of the normal lags that exist between the period to which traditional data sources pertain and their publication. Since economic temperatures are changing so rapidly, not least during the current pandemic, these traditional data sources could be losing some relevance. There are in addition arguably now many complicating factors in how we interpret traditional data sources at present that have been generated by the pandemic. For example, how should we interpret data on the ‘food away from home' component of consumer price indices in a period when most restaurants have been closed?
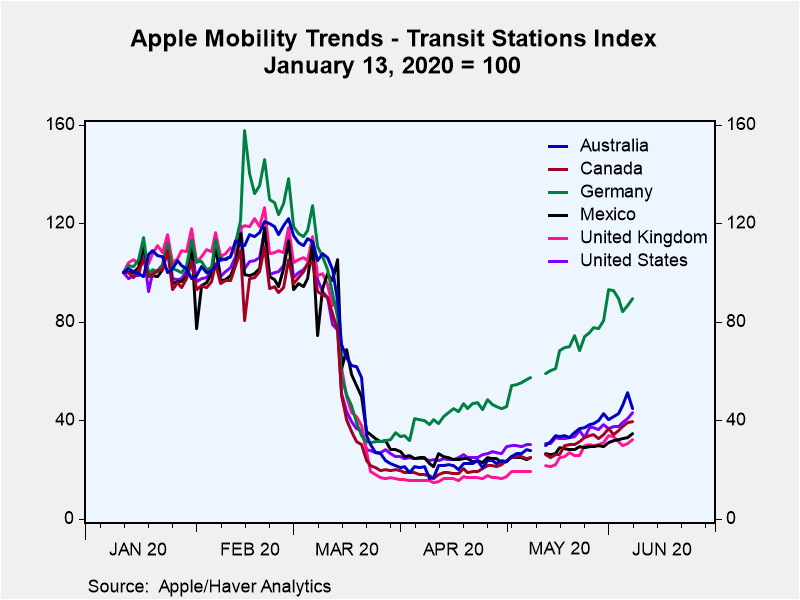
Recent trends in two non-traditional data sources are highlighted in the charts above. The first shows some daily mobility data from Apple for the use of public transport (transit). This offers a good gauge of the readiness of the public to emerge from a lockdown scenario and travel to/from work or for leisure. The latest data for a few selected economies show a much greater readiness of the German public to travel again compared with, say, the US, UK or Canada.
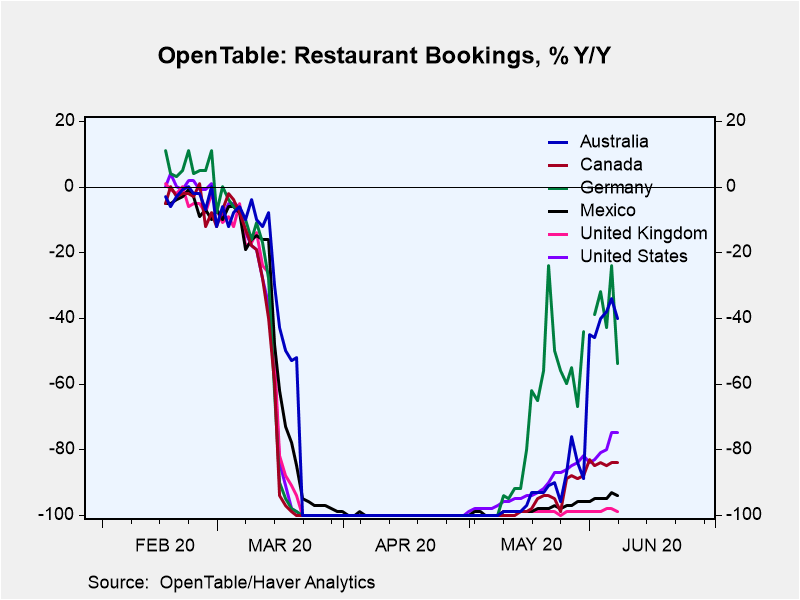
Similarly daily data from Opentable for restaurant bookings – another helpful high-frequency gauge of consumer confidence – appear to be bouncing back strongly from their lockdown-induced slump in Germany and Australia. Some signs of life can also be seen in the data for the US and Canada.
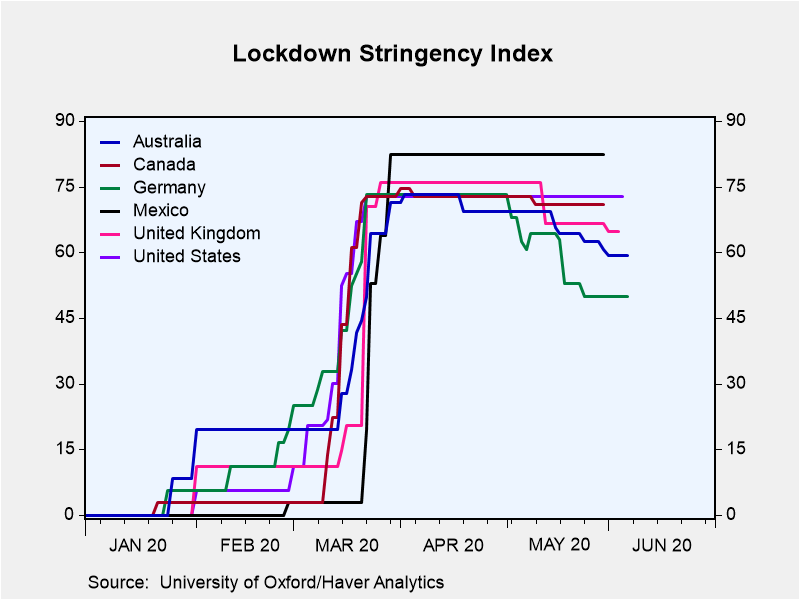
 Both these data sets serve to illustrate that the likely strength of an economy's recovery in the period ahead will be driven by the degree to which lockdown measures are being eased. Latest data from the University of Oxford accordingly show that lockdown policies in Germany and to a lesser extent Australia are now less stringent than in many other major developed economies, as evidenced in the final chart.
Apple's mobility data can be accessed via Haver's Transportation database (TRANSPRT), OpenTable's data for restaurant bookings can be accessed via the Global Daily (INTDAILY) database and Oxford University's indicators of Lockdown stringency can be accessed via the Environment, Social and Governance indicators database (ESG).
Andrew Cates
AuthorMore in Author Profile »Andy Cates joined Haver Analytics as a Senior Economist in 2020. Andy has more than 25 years of experience forecasting the global economic outlook and in assessing the implications for policy settings and financial markets. He has held various senior positions in London in a number of Investment Banks including as Head of Developed Markets Economics at Nomura and as Chief Eurozone Economist at RBS. These followed a spell of 21 years as Senior International Economist at UBS, 5 of which were spent in Singapore. Prior to his time in financial services Andy was a UK economist at HM Treasury in London holding positions in the domestic forecasting and macroeconomic modelling units. He has a BA in Economics from the University of York and an MSc in Economics and Econometrics from the University of Southampton.
More Economy in Brief
 Global| Feb 05 2026
Charts of the Week: Balanced Policy, Resilient Data and AI Narratives
by:Andrew Cates


