 Global| Jun 17 2003
Thailand’s First Quarter GDP Growth Above Consensus
Summary
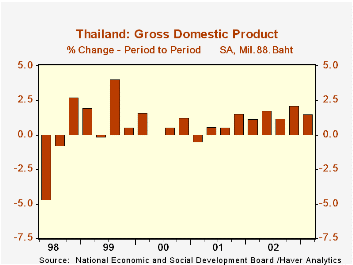
Seasonally adjusted Gross Domestic Product in Thailand rose 1.5% in the first quarter of 2003 from the fourth quarter of 2002, or slightly above consensus expectations of 1.3%. The outbreak of SARS (severe acute respiratory syndrome) [...]

Seasonally adjusted Gross Domestic Product in Thailand rose 1.5% in the first quarter of 2003 from the fourth quarter of 2002, or slightly above consensus expectations of 1.3%.
The outbreak of SARS (severe acute respiratory syndrome) in late March had little effect on the first quarter data. Even though Thailand has been less directly affected than China, Hong Kong and Taiwan, it will likely suffer, in the second quarter, from reduced tourism. Nevertheless, the government has raised its estimate of growth for the year as a whole to 5.5%.from 5.0%.
Exports continue to be strong and the government is also counting on increased domestic demand as a result of the measures it has undertaken. Taxes have been reduced and subsidies to rice farmers have been increased. In addition low interest rates are having a positive impact on residential construction and the purchase of durable goods.
| Thailand's GDP (Mil.1998.Baht) | Q1 2003 | Q4 2002 | Q3 2002 | Q/Q | Y/Y | 2002 | 2001 | 2000 |
|---|---|---|---|---|---|---|---|---|
| Private Consumption | 458,117 | 449,918 | 430,082 | 1.8 | 6.5 | 4.7 | 3.7 | 4.9 |
| Public Consumption | 72,111 | 68,453 | 76,940 | 5.3 | -6.3 | 0.5 | 2.9 | 2.6 |
| Fixed Capital Formation | 167,081 | 161,299 | 157,123 | 3.6 | 6.3 | 6.3 | 0.9 | 5.3 |
| Exports | 547,877 | 529,354 | 488,716 | 3.5 | 12.1 | 10.9 | -4.1 | 17.2 |
| Imports | -414,909 | -402,592 | -370,622 | 3.1 | 11.9 | -11.3 | -5.5 | 27.3 |
| GDP | 839,791 | 827,143 | 786,548 | 1.5 | 6.8 | 5.3 | 1.9 | 4.7 |
by Louise Curley June 17, 2003

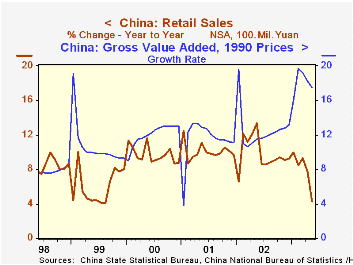
The impact of SARS (Sever Acute Respiratory Syndrome) on China's economy is beginning to show up in recently released data. Retail sales year over year growth fell to 4.3% in May the lowest rate since August,1990. Government measures to control the disease, such as the closing of movie theaters and internet cafes and the prohibition of mass gatherings may well have contributed more to the decline in sales than the direct effects of the disease itself. With the peaking of the disease and the relaxation of restrictions, the worst of the impact on retail sales may have been felt.
The effect on production as measured by the growth rate of industry value added in 1990 prices has been less severe. The rate of growth has been declining since the February, 2003 peak of 17.5% and is now 15.9% .This is still above the rate in January and the average for all of 2002.
| Year/Year % Change | May 2003 | Apr 2003 | Mar 2003 | Feb 2003 | Jan 2003 | 2002 | 2001 | 2000 |
|---|---|---|---|---|---|---|---|---|
| Retail Sales | 4.3 | 7.9 | 9.3 | 8.5 | 10.0 | 9.8 | 10.1 | 11.0 |
| Gross Value Added | 15.9 | 16.4 | 17.2 | 17.5 | 14.8 | 12.4 | 9.9 | 11.0 |


