 Global| Feb 01 2005
The Difference in Unemployment Rates in the Euro Zone and Japan Due Largely to Japanese Workers' Withdrawal from [...]
Summary
While activity in the Euro Zone's and Japan's manufacturing sectors increased for the second month in January according to the purchasing managers surveyed by NTC Research, Ltd, for Reuters Group Plc., the purchasing managers [...]

While activity in the Euro Zone's and Japan's manufacturing sectors increased for the second month in January according to the purchasing managers surveyed by NTC Research, Ltd, for Reuters Group Plc., the purchasing managers indicated no special interest in increasing employment. As a result there is little likelihood that unemployment rates will be coming down soon in these areas. However, there are other factors at work, besides employment that affect the unemployment rate.
This is apparent in the comparison of unemployment rates in the Euro Zone and Japan. Although the unemployment in the Euro Zone fell to 8.8% in December from 8.9% in November, the rate of unemployment has kept within a narrow range of 8.8% to 9.0% for the past two years. Japan's unemployment rate fell to 4.4% in December from 4.5% in November. In contrast to the Euro Zone, Japan has experienced a significant decline in the unemployment rate from 5.7% in mid 2002 to 4.4% in December. The two unemployment rates are shown in the first chart.
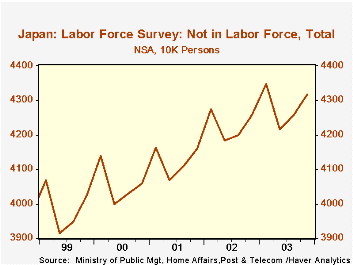
In Japan, employment has shown little change. With steady employment and rising unemployment, one would expect the labor force to increase but it has declined significantly as a result, largely of workers leaving the labor force. The second chart shows the rise in the numbers of Japanese workers not in the labor force. There are no comparable data for the Euro Zone, however, in contrast to Japan, employment has continue to rise as employment in the service sector has more than offset the declines in the industrial sector. With rising employment and rising unemployment, the labor force in the Euro Zone has continued to rise. This suggests that the number of workers leaving the labor force are probably on a much smaller scale than those in Japan .
| Dec 05 | Nov 04 | Dec 04 | M/M Dif | Y/Y Dif |
2004 | 2003 | 2002 | ||
|---|---|---|---|---|---|---|---|---|---|
| Euro-Zone: Unemployment Rate (%) | 8.8 | 8.9 | 8.9 | -0.1 | -0.1 | 8.9 | 8.9 | 8.5 | |
| Japan: Unemployment Rate (%) | 4.4 | 4.5 | 4.9 | -0.1 | -0.5 | 4.7 | 5.3 | 5.4 | |
| Japan: Not in Labor Force (millions) | 4.30 | 4.25 | 4.20 | 1.2% | 2.23% | 4.22 | 4.12 | 4.06 | |
| Q4 04 | Q3 04 | Q2 O4 | Q3 03 | Q4 03 | Q3/Q3 | Y/Y | 2003 | 2002 | |
| Euro-Zone: Employment (millions) | 134.7 | 134.5 | 133.2 | 0.15 | 0.40 | 134.1 | 133.9 | ||
| Japan: Employment (mil) | 63.2 | 63.8 | 63.7 | 64.0 | -0.05 | 0.08 | 63.3 | 63.2 |


