 Global| Jan 03 2011
The IMF'S Fiscal Monitor: Government Debt/GDP
Summary
The IMF's Fiscal Monitor data, which were recently added to the IFS and IFSANN databases, provide the best available means of comparing fiscal developments and the IMF's projections of such developments for most countries. The Fiscal [...]
The IMF's Fiscal Monitor data, which were recently added to the IFS and IFSANN databases, provide the best available means of comparing fiscal developments and the IMF's projections of such developments for most countries. The Fiscal Monitor provides recent data and projections through 2015 for the governments' total and primary balances, the cyclically adjusted total and primary budgets, expenditure, revenues, and gross and net debt--all expressed as a percent of GDP. In addition, the Monitor includes an historical series of Government Debt as a percent of GDP, which, in some cases, goes back to 1901.
Comparing government balances and debt ratios among countries has always been plagued by differences in the availability of consistent data among countries. In many cases, particularly before 1980, balances and debt data for the gross general government, the preferred measure, were not available and, in some countries gross national rather than domestic product is the only available output measure. While these problems still exist in the IMF's Fiscal Monitor data, we can be assured that there has been a major effort to minimize them.
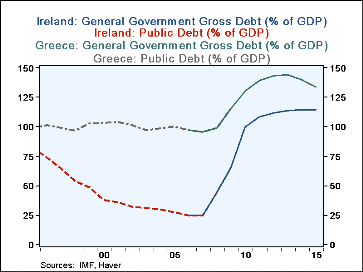
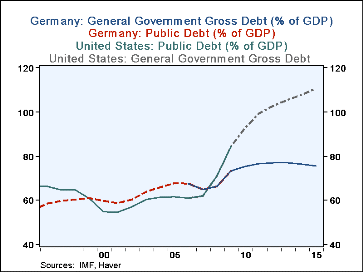
While those series in the Fiscal Monitor that include projections are useful in showing possible future developments, they do not put current developments in a long term perspective. That can be done for the Government Debt/GDP series by linking the General Government Debt Goss Debt as a % of GDP series to the Public Debt as a % of GDP series. The attached charts showing the linked series for Greece and Ireland and for the U. S. and Germany give some historical perspective to the comparisons. Data points are shown in the table below.
| 2006 | 2007 | 2008 | 2009 | 2010 | 2011 | 2012 | 2015 | |
|---|---|---|---|---|---|---|---|---|
| Germany | ||||||||
| Public Debt(% of GDP) | 67.6 | 64.9 | 66.3 | 73.5 | ||||
| General Government Gross Debt (% of GDP) | 67.6 | 64.9 | 66.3 | 73.5 | 75.3 | 76.5 | 76.4 | 75.6 |
| United States | ||||||||
| Public Debt (% of GDP) | 61.1 | 62.1 | 71.1 | 84.3 | ||||
| General Government Gross Debt (% of GDP) | 61.1 | 62.1 | 71.1 | 84.3 | 92.7 | 99.3 | 102.9 | 110.7 |
| Ireland | ||||||||
| Public Debt (% of GDP) | 24.8 | 25.0 | 44.4 | 65.5 | ||||
| General Government Gross Debt (% of GDP) | 24.9 | 25.0 | 44.4 | 65.5 | 99.4 | 107.8 | 111.6 | 113.9 |
| Greece | ||||||||
| Public Debt(% of GDP) | 97.1 | 95.6 | 99.2 | 115.2 | ||||
| General Government Gross Debt (% of GDP) | 97.1 | 95.6 | 99.2 | 115.2 | 130.2 | 139.3 | 143.6 | 133.9 |
More Economy in Brief
 Global| Feb 05 2026
Charts of the Week: Balanced Policy, Resilient Data and AI Narratives
by:Andrew Cates


