 Global| Dec 04 2006
Third Quarter GDP in Thailand Rises at an Annual Rate of 6%
Summary
Thailand's Gross Domestic Product increased in third quarter at an annual rate of 6.0% from the second quarter. The rise was higher than expected and has prompted the government to raise its 2006 growth forecast to close to 5% from [...]

Thailand's Gross Domestic Product increased in third quarter at an annual rate of 6.0% from the second quarter. The rise was higher than expected and has prompted the government to raise its 2006 growth forecast to close to 5% from its earlier estimate of 4.7%.
In spite of the acceleration of growth during the third quarter, the year over year increases show a slowing trend, largely attributed to the political upheaval caused by dissatisfaction with the government of Prime Minister Thaksin Shinawatra and the subsequent coup by the armed forces on September 19th. The political situation has quieted and the military authorities have promised to hold elections next October.
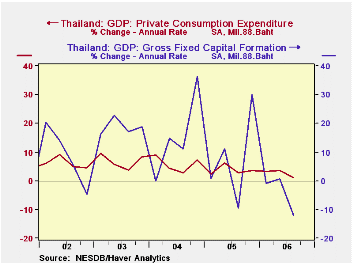
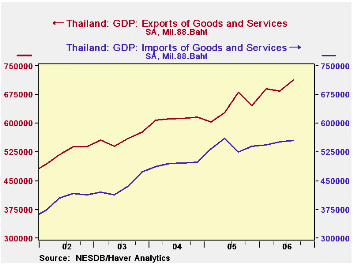
The acceleration of growth in the third quarter was due entirely to a 27.6 billion bhat increase in net exports, the result of a 4.4% increase in exports and a 0.4% increase in imports. The first chart shows exports and imports and the widening gap in recent quarters. Domestic demand declined by 3.4 billion bahts. Increases of 1.7 billion bahts in private consumption and 3.1 billion bahts in inventories were offset by a declines in public consumption of 0.7 billion bahts and fixed investment spending of 7.4 billion bahts. The second chart shows the annual rate of change in private consumption and in fixed investment spending. The annual rate of increase in private consumption dropped from 3.66% in the second quarter to 1.23% in the third quarter. The annual rate of change in fixed investment went from 0.63% in the second quarter to -12.01% in the third quarter..
| THAILAND | 3Q 06 | 2Q 06 | Dif |
|---|---|---|---|
| Gross Domestic Product (Bil. 88 Bahts) | 1,020.1 | 1,005.2 | 14.9 |
| Expenditure on GDP Dollar) | 1,022.0 | 997.9 | 24.2 |
| Domestic Demand | 862.6 | 866.0 | -3.4 |
| Private Consumption | 543.8 | 542.2 | 1.7 |
| Public Consumption | 92.0 | 92.6 | -0.7 |
| Fixed Investment | 228.9 | 236.3 | -7.4 |
| Change in Inventories | -2.1 | -5.1 | 3.1 |
| Net Exports | 159.4 | 131.8 | 27.6 |
| Exports | 713.6 | 683.9 | 29.7 |
| Imports | 554.2 | 552.0 | 2.1 |
| Statistical Discrepancy | -2.0 | 7.4 | -9.3 |
More Economy in Brief
 Global| Feb 05 2026
Charts of the Week: Balanced Policy, Resilient Data and AI Narratives
by:Andrew Cates


