 Global| Nov 19 2018
Trade and Current Account Trends Decay in EMU
Summary
The euro area shows sharp drops in its current account and goods surpluses over three months, six months and 12 months. The current account surplus has dropped to 17 billion euros, a decline of 23 billion euros from its level of 12 [...]
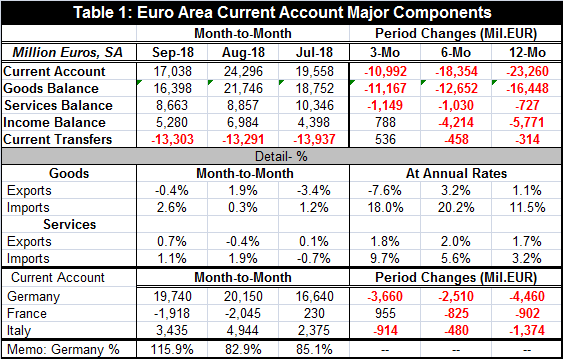
 The euro area shows sharp drops in its current account and goods surpluses over three months, six months and 12 months. The current account surplus has dropped to 17 billion euros, a decline of 23 billion euros from its level of 12 months ago. The goods surplus has been halved to 16 billion euros on a decline of 16 billion euros from one year ago. Goods exports are falling over three months and up by just 1.1% over 12 months. Goods imports are going strong, churning out an 18% annual rate gain over three months while rising by a strong 11.5% over 12 months. The deficit erosion has come mostly in the goods account and is attributable mostly to sharply rising imports. The services surplus is slightly lower over 12 months. But EU transfers (substantially from ‘guest workers) are a net outflow item; they also dipped slight over 12 months and it registered an outflow of approximately 13 billion euros as of September.
The EMU position is not the simple the sum of its members’ balance of payments (BOP) positions. They continue to report their BOP on a country by country jurisdictional basis while the EMU current account is the sum of the members’ net positions in trade with countries that lie outside the currency union. The German current account will include intra-union trade with France, Italy, and so on, just as Italian data will include trade with France, Germany, and so on. These intra-union flows have to be netted to get to the proper EMU accounting. Germany has accounted for a deficit reduction of about 4.5 billion euros, but the German current account surplus at 19.7 billion euros remains large and is larger than the EMU surplus as a whole (but the German figure includes intra-union trade!). France runs a deficit of about 2 billion euros after a worsening in the deficit over 12 months of about 1 billion euros. Italy still logs a surplus of 3.4 billion euros after a worsening of 1.3 billion euros.
Euro-surplus is diminished and trending lower
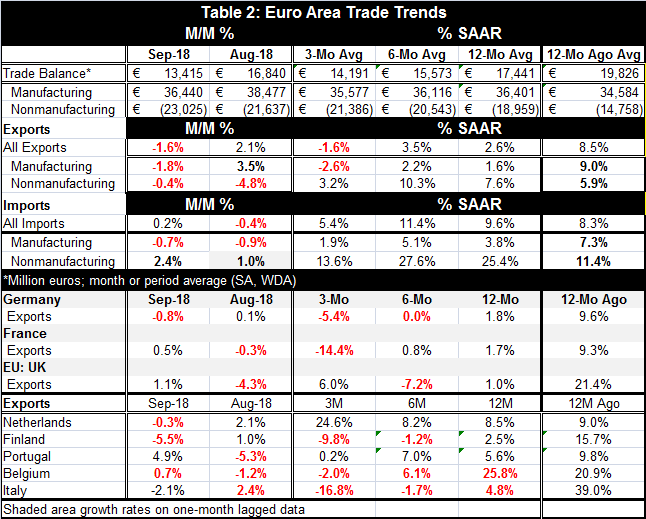
Turning to more detail on goods trade (Table 2 below), we can partition goods trade into trade in manufactures and in nonmanufactures. Manufactures trade in the EMU runs a surplus while trade in nonmanufactures is in deficit. In looking at these flows, we get a better sense of the nature of the adjustment that EMU trade flows have undergone.
We have already seemed that only a portion of the overall balance adjustment is attributable to Germany. The surplus on manufacturing trade has actually gotten larger over the past year, rising from 34.8 billion euros to 36.4 billion euros. This probably means that the deficit reduction – large as it is- is happenstance and related to rising commodity prices. The deficit on nonmanufactures rose to 23 billion euros in September 2018 from 20.6 billion euros a year ago (note: the year-ago values are not in the table). Over the past year, manufacturing export and imports have grown at nearly the same pace. Imports grew a bit faster, but not enough to contain the deficit and the more sizable export flow that was generated by a slightly lower export growth rate. But for nonmanufactures, exports gained 7.6%, well below the 25.4% gain by imports. That is what drove the overall and nonmanufactures deficit higher. And little of that looks like any fundamental change in trade; it’s just higher commodities prices at work.
Among Germany, France, the U.K., the Netherlands, Finland, Portugal, Belgium, and Italy, exports are falling over three months everywhere except the Netherlands and Portugal. Year-on year export gains are 2.5% or less for Germany, France, the U.K., and Finland. Belgium shows sizeable export gains over 12 months at 25.8%, but it is alone in that. After Belgium’s strength, the highest gain is from the Netherlands (8.5%), Portugal (5.6%), and Italy (at 4.8%). None of those will add much to growth to GDP and in most cases national imports will be growing as fast or faster. Trade flows have turned lethargic and in all these countries except the U.K. Everywhere but the U.K., 12-month growth rates are greater than annualized three-month growth rates. The Baltic dry goods index of global trade volume continues to sink, suggesting that these flow slow-downs are not aberrant but are part of a global trend.

Robert Brusca
AuthorMore in Author Profile »Robert A. Brusca is Chief Economist of Fact and Opinion Economics, a consulting firm he founded in Manhattan. He has been an economist on Wall Street for over 25 years. He has visited central banking and large institutional clients in over 30 countries in his career as an economist. Mr. Brusca was a Divisional Research Chief at the Federal Reserve Bank of NY (Chief of the International Financial markets Division), a Fed Watcher at Irving Trust and Chief Economist at Nikko Securities International. He is widely quoted and appears in various media. Mr. Brusca holds an MA and Ph.D. in economics from Michigan State University and a BA in Economics from the University of Michigan. His research pursues his strong interests in non aligned policy economics as well as international economics. FAO Economics’ research targets investors to assist them in making better investment decisions in stocks, bonds and in a variety of international assets. The company does not manage money and has no conflicts in giving economic advice.
More Economy in Brief

 Global| Feb 05 2026
Charts of the Week: Balanced Policy, Resilient Data and AI Narratives
by:Andrew Cates

