 Global| Aug 15 2006
Turkey's Leading Composite Indicators and Business Confidence: Harbingers of Lower Growth?
Summary
The National Association of Home Builders (NAHB) reported that the August Composite Housing Market Index at 32 fell another 18% from 39 in July to the lowest level since February, 1991. Consensus expectations were for only a small [...]
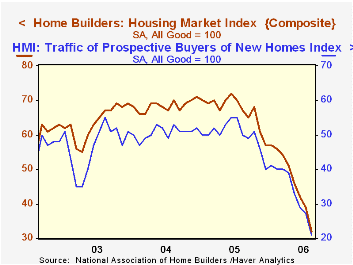
The National Association of Home Builders (NAHB) reported that the August Composite Housing Market Index at 32 fell another 18% from 39 in July to the lowest level since February, 1991. Consensus expectations were for only a small decline to 38.
During the last twenty years there has been a 75% correlation between the y/y change in the Composite Index and the change in single family housing starts.
The sub-indexes covering sales of single family homes (-50.7% y/y) and sales in the next six months (-48.1% y/y) were both down sharply again m/m.
An index of the traffic of prospective home buyers fell further in August. At 21 (-58% y/y) it was the lowest since January, 1991 and the second lowest since the index began in 1985.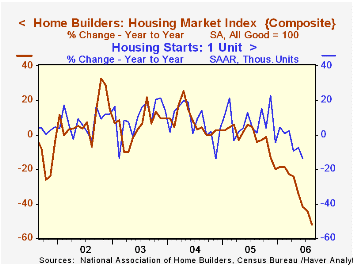
Housing markets in all regions of the U.S. weakened this month. The index in the Northeast was off 8.1% (-51.4% y/y). In the Midwest the index dropped 25% (-66.7% y/y). The West was down 19.2% (-50.6% y/y) and the South declined 18% (-44.6% y/y).
The NAHB index is a diffusion index based on a survey of builders. Readings above 50 signal that more builders view conditions good than poor.
Visit the National Association of Home Builders.
| Nat'l Association of Home Builders | August | July | August '05 | 2005 | 2004 | 2003 |
|---|---|---|---|---|---|---|
| Composite Housing Market Index | 32 | 39 | 67 | 67 | 68 | 64 |
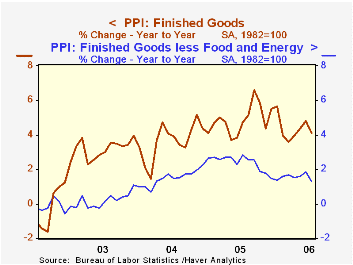
The producer price index for finished goods edged up 0.1% in July, in line with Consensus expectations. The index had increased by 0.5% in June.
Prices for finished goods excluding food and energy unexpectedly fell 0.3% in July after rising 0.2% the previous month. Consensus estimates had been a 0.1% gain. Prices of light trucks dropped 3.1% compared with an increase of 0.4% in June. Prices in July were also lower for passenger cars (-0.8%) and civilian aircraft (-0.1%).
The finished energy goods index rose 1.3% (+16.2% y/y) in July after a 0.7% rise in June. Residential electric power prices advanced 1.8% after a 2.8% drop in June. Residential natural gas also rose (+0.9%) compared with a 3.7% decline in June. Gasoline prices moderated somewhat in July (+0.7%) after huge increases in March through June. The gasoline price index in July was 33.7% higher than a year ago.
The lack of inflationary pressure in finished goods was not shown in the intermediate and crude goods indexes. Intermediate goods prices rose 0.5% in July after a 0.7% increase in June. Excluding food and energy, the intermediate goods index was 0.7% higher compared with an 0.8% advance the prior month. Intermediate energy prices were down last month (-0.1%) led by diesel fuel which declined by 5.0% after rising 5.4% in June. The indexes for jet fuel, residential fuel and home heating oil were all lower in July as well. Industrial and commercial natural gas prices rose, as did liquefied petroleum gas prices.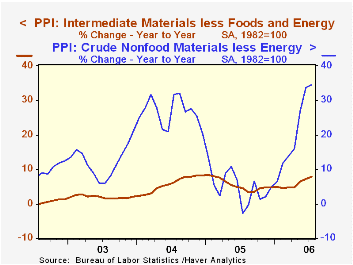
Materials prices for nondurable manufacturing increased 0.2% last month after a 1.0% advance in June. The index for materials for durable goods manufacturing climbed 2.3% in July compared with a 1.1% gain the previous month. Prices for materials for construction moved up 0.7% after a 0.3% rise in June.
The PPI for crude materials soared 3.1% in July after declining 1.7% in June. Crude energy materials prices rose 4.8% led by natural gas (+1.2%) and crude petroleum (+9.4%). Crude energy prices had dropped by 6.8% in June. Prices of crude materials less food and energy increased 1.3% following a rise of 1.7% in June.
| Producer Price Index | July | June | Y/Y | 2005 | 2004 | 2003 |
|---|---|---|---|---|---|---|
| Finished Goods | 0.1% | 0.5% | 4.1% | 4.9% | 3.6% | 3.2% |
| Core | -0.3% | 0.2% | 1.3% | 2.4% | 1.5% | 0.2% |
| Intermediate Goods | 0.5% | 0.7% | 8.8% | 8.0% | 6.6% | 4.7% |
| Core | 0.7% | 0.8% | 7.9% | 5.5% | 5.7% | 2.0% |
| Crude Goods | 3.1% | -1.7% | 6.7% | 14.6% | 17.5% | 25.1% |
| Core | 1.3% | 1.7% | 34.6% | 4.8% | 26.5% | 12.4% |
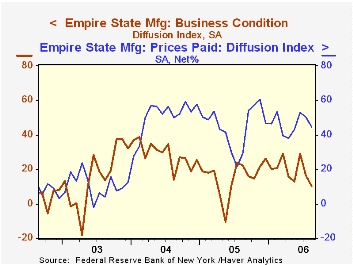
Manufacturing activity in New York State grew in August but at the slowest pace in 2006. The Empire State Manufacturing Index of General Business Conditions, reported by the Federal Reserve Bank of New York, fell 6.24 points to 10.34 in August. Consensus expectations had been for a lesser decline to 14.25.
Since the series' inception in 2001 there has been a 75% correlation between the index level and the three month change in U.S. factory sector industrial production.
The indexes for new orders & shipments remained positive and higher than previous month's indexes but unfilled orders went into negative territory. The index of inventories was negative for the third consecutive month. The index of employment was positive but remained at a low level, indicating a modest increase in employment.
Pricing pressure continued to ease. Since 2001 there has been an 88% correlation between the index of prices paid and the three month change in the core intermediate materials PPI.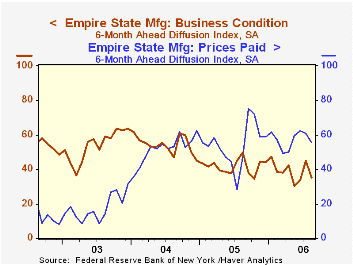
Like the Philadelphia Fed Index of General Business Conditions, the Empire State Business Conditions Index reflects answers to an independent survey question; it is not a weighted combination of the components.
New York manufacturers were less optimistic in August. The Empire State index of expectations for business conditions in six months dropped 10 points to 35.20 with 48% of respondents expecting an improvement in conditions versus 57% during the previous month.
The Empire State Manufacturing Survey is a monthly survey of manufacturers in New York State conducted by the Federal Reserve Bank of New York. Participants from across the state in a variety of industries respond to a questionnaire and report the change in a variety of indicators from the previous month. Respondents also state the likely direction of these same indicators six months ahead. April 2002 is the first report, although survey data date back to July 2001.
For more on the Empire State Manufacturing Survey, including methodologies and the latest report, click here.
| Empire State Manufacturing Survey | August | July | August '05 | 2005 | 2004 | 2003 |
|---|---|---|---|---|---|---|
| General Business Conditions (diffusion index) | 10.34 | 16.58 | 22.61 | 15.56 | 28.79 | 15.98 |
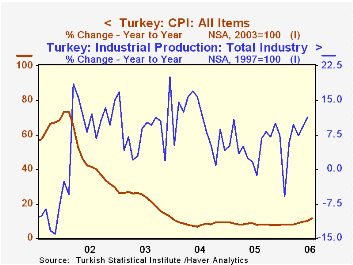
The Composite Leading Indicator (MBONCUE-SUE) in Turkey is casting some doubt on the continuance of the period of good economic growth and relatively low inflation that the country has experience over the past few years. As can be seen in the first chart the year over year growth in industrial production has ranged between 5% and 9% while the year over year increase in consumer prices has declined from around 22% in 2003 to 8.6% in 2004 and 8.2% in 2005.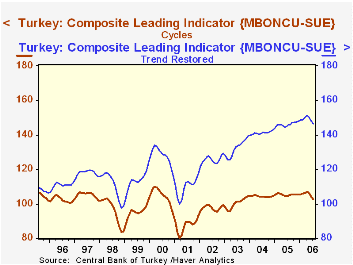
Turkey's composite leading indicator is expressed in three differ forms: (1) Trend Restored (2) Cycle and (3) a six month moving average. All three forms have declined in June and July and, except for Trend Restored, they are below July, 2005 and the Trend Restored form is only 0.51% above July, 2005. The second chart shows the Trend Restored and Cycle. The six-month rate of change shows a similar trend.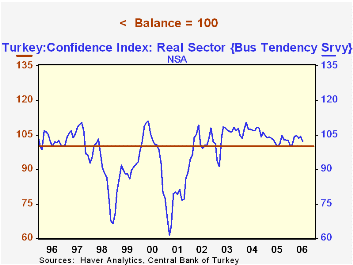
The Business Tendency Survey increased in June but has declined in July from 104.4 to 102.4. This measure is so designed that values above 100 represent a preponderance of optimists, values below 100, a preponderance of pessimists and a value of 100, balance between optimists and pessimists. Although the current value is 2.4 points above 100, indicating a preponderance of optimists, it is well below the recent peak of 110.3 in February, 2004.
| Turkey | Jul 06 | Jun 06 | Jul 05 | M/M % | Y/Y % | 2005 | 2004 | 2003 |
|---|---|---|---|---|---|---|---|---|
| Composite Leading Indicator | ||||||||
| Trend Restored | 146.25 | 148.02 | 145.51 | -1.20 | 0.51 | 146.13 | 141.15 | 132.27 |
| Cycle | 102.79 | 105.25 | 104.86 | -1.40 | -1.97 | 105.41 | 144.40 | 100.30 |
| Six-month Rate of Change | -2.43 | 0.09 | 2.49 | -2.52* | -4.92* | 3.52 | 5.14 | 6.81 |
| Business Tendency Survey | ||||||||
| Confidence Index (100=Balance , >100=Optimistic, <100=Pessimistic |
102.4 | 104.4 | 103.5 | -2.20 | 2.10 | 122.8 | 106.8 | 104.1 |
More Economy in Brief
 Global| Feb 05 2026
Charts of the Week: Balanced Policy, Resilient Data and AI Narratives
by:Andrew Cates


