 Global| Oct 29 2007
U.K. Housing Market Cooling Off
Summary
The average price of the quality adjusted house in the UK declined 0.11% in October to 176.1 thousands of British pounds, the first decline since December, 2005. Other measures of activity in the housing market revealed in the [...]
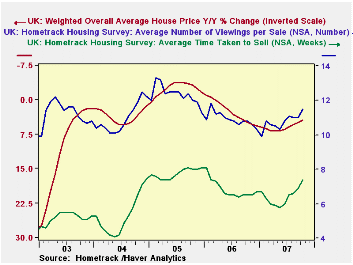
The average price of the quality adjusted house in the UK declined 0.11% in October to 176.1 thousands of British pounds, the first decline since December, 2005. Other measures of activity in the housing market revealed in the Hometrack Housing Survey also showed weakness. The ratio of the selling price to the asking price declined to 94.3 from 94.8 in September. The average time to sell a house rose to 7.4 weeks from 6.9 and the number of viewings before a sale rose to 11.5 from 11.0. These last two indicators are shown with the house price in the first chart. The house price is on an inverted scale.
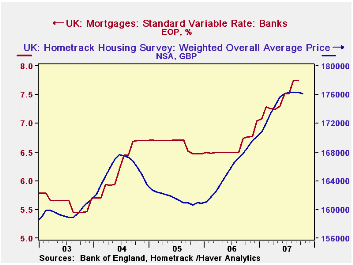
December, 2005 marked the end of a year and a half of year of almost constant year to year declines in the quarterly house prices. In spite of the price declines, which may well have resulted from rising interest rates at that time, the housing market did not collapse. Construction remained strong. Once again, there has been a period of rising interest rates that has now begun to affect the housing market. The standard average variable interest rate on mortgages is shown in the second chart together with the house price. The question now is: Will the current rise in interest rates leave the housing market as unscathed as it did in the 2004-5 period?
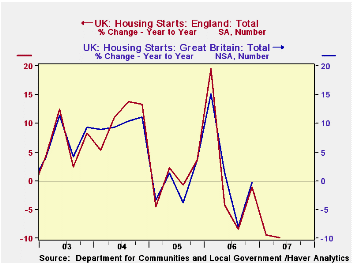
In one respect, that regarding housing starts, the effect is already apparent. There were only two year to year declines in England's quarterly housing starts in 2005, one of 4.6% in the first quarter and one of 0.74% in the third quarter. Contrast that with the current decline beginning in the second quarter of 2006 and continuing into the second quarter of 2007. Data for housing starts for all of Great Britain are available only through 2006, but data for England are available through the second quarter of 2007. Since the trend in activity in England largely determine the trend in activity for the whole United Kingdom, as the third chart attests, it is clear that there has already been a significant impact on actual housing starts.
| UK HOMETRACK HOUSING SURVEY | Oct 07 | Sep 07 | Oct 06 | M/M% Chg | Y/Y % Chg |
2006 | 2005 | 2004 |
|---|---|---|---|---|---|---|---|---|
| Weighted Average Price (1000 GBP) | 176.1 | 176.3 | 168.6 | -0.11 | 4.45 | 165.7 | 161.9 | 165.5 |
| Sale's Price as % of Asking Price | 94.3 | 94.8 | 94.9 | -0.5* | -0.6* | 94.7 | 93.3 | 95.1 |
| Average Time to Sell in weeks | 7.4 | 6.9 | 6.5 | 0.5* | 0.9* | 6.8 | 7.8 | 5.3 |
| Average Number of Viewings per Sale | 11.5 | 11.0 | 10.8 | 0.5* | 0.7* | 10.9 | 12.3 | 11.00 |
| Q2 07 | Q1 07 | Q2 06 | Q/Q Chg | Y/Y Chg | 2006 | 2005 | 2004 | |
| Housing Starts in England (000) | 39.7 | 42.8 | 47.2 | -7.18 | -9.92 | 178.5 | 177.0 | 176.6 |
| * difference |


