 Global| Aug 10 2011
U.S. Budget Deficit Reaches $1.1 Trillion For Fiscal 2011 to Date
Summary
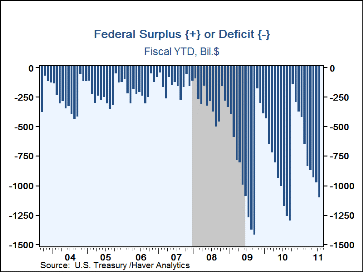
The U.S. Government ran a $129.4 billion budget deficit in July, bringing fiscal 2011 to date to $1,099.9 billion, according to the U.S. Treasury's "Monthly Treasury Statement". Forecasters had estimated $140.0 billion for the month, [...]
 The U.S. Government ran a $129.4 billion budget deficit in July, bringing
fiscal 2011 to date to $1,099.9 billion, according to the U.S. Treasury's
"Monthly Treasury Statement". Forecasters had estimated $140.0
billion for the month, so this marks a fourth consecutive month of
smaller-than-expected deficits. At this time in fiscal 2010, the
cumulative deficit was $1,169.1 billion. For this
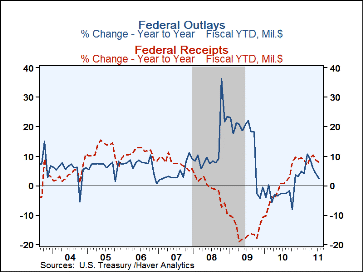
fiscal year to date, receipts (net of refunds) have been $1,893.1 billion, up
8.0%
from the year earlier amount, while outlays have been $2,993.0 billion, up 2.4%
from the 2010 cumulative amount.
Among receipts, individual income taxes remain strong from a year ago, with the year-to-date amount up by 23.8%. The increment for the month of July alone was 18.1%; this followed a 3.7% increase in June and 55.1% in May. Corporate income taxes were a mere $6.3 billion; July is not a month when major corporate collections are scheduled. The FYTD amount is $140.5 billion, up 0.6% from July 2010. Social insurance taxes continue to run below year-ago amounts, reflecting the cut in the rate for social security contributions paid by individual employees; the FYTD amount is down 5.6% from this point in FY2010.
Net outlays in July were $288.4 billion, almost exactly 10% below the year-ago amount; as noted above the cumulative amount for FY2011 is up 2.4% from a year earlier. As we explained here last month, the individual spending categories oscillate from month-to-month, making interpretation difficult. Year-on-year, we see that the cumulative fiscal-year measure of defense outlays is growing ever more slowly, and the July growth rate was just 0.4%. Income security is also slowing, as the modest expansion of the economy is restraining these welfare-type benefits; the category was down 5.2% for the fiscal year-to-date. Health-related spending fell in July; in particular, following a spike in Medicaid grants in June, these payments to state governments dropped back in July. As ever, interest costs continue to grow; the month of July saw them up 19.8% from July 2010 and the FYTD amount is up 15%, following 14.4% in the year through June.
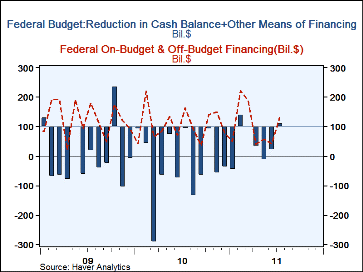
Finally, through a client inquiry in recent weeks, our attention was drawn to the summary of the means of finance in Table 2 of the Treasury's Statement. Since the debt outstanding had reached the debt ceiling, the Treasury could not finance the deficit by simply borrowing all it needed in the markets; that covered just $15.9 billion of the month's $129.4 billion financing need. So we saw the cash balance fall by $69.8 billion and reliance on "Other Means of Finance" for $43.7 billion.
Haver's basic data on Federal Government outlay and receipts and summary presentations of the Budget from both OMB and CBO are contained in USECON. Considerable detail, including the entire Monthly Treasury Statement, is given in the separate GOVFIN database.
| US Government Finance | Jul'11 | FY 2011 | FY 2010 | FY 2009 | FY 2008 | |
|---|---|---|---|---|---|---|
| thru July | thru July | Total | ||||
| Budget Balance | -$129.4 | -$1,099.9 | -$1,169.1 | -$1,294.1B | $-1,415.7B | $-454.8B |
| Net Revenues | 159.1 | 1,893.1 | 1,752.5 | 2,161.7 | 2,104.4 | 2,523.9 |
| (Y/Y % Change) | 2.3% | 8.0% | 0.7% | 2.7% | -16.6% | -1.7% |
| Individual Income Taxes | 18.1 | 23.8 | -4.1 | -1.8 | -20.1 | -1.5 |
| Corporate Income Taxes | -7.4 | 0.6 | 33.7 | 38.5 | -54.6 | -17.8 |
| Social Insurance Taxes | -10.5 | -5.6 | -3.6 | -2.9 | -1.0 | 3.5 |
| Net Outlays | $288.4 | $2,993.0 | $2,921.6 | $3455.9 | $3,520.1 | $2,978.7 |
| (Y/Y % Change) | -10.0% | 2.4% | -2.8% | -1.8% | 18.2% | 9.1% |
| Nat'l Defense | -9.1 | 0.4 | 5.2 | 5.0 | 7.6 | 11.8 |
| Health | -15.3 | 3.3 | 10.2 | 10.4 | 19.1 | 5.4 |
| Medicare | -29.6 | -0.8 | 4.6 | 5.0 | 10.1 | 4.1 |
| Income Security | -15.7 | -5.2 | 19.5 | 16.9 | 24.9 | 16.8 |
| Social Security | 3.1 | 3.5 | 3.4 | 3.5 | 10.7 | 5.3 |
| Interest | 19.8 | 15.0 | 10.5 | 3.3 | -24.5 | 6.3 |
Carol Stone, CBE
AuthorMore in Author Profile »Carol Stone, CBE came to Haver Analytics in 2003 following more than 35 years as a financial market economist at major Wall Street financial institutions, most especially Merrill Lynch and Nomura Securities. She had broad experience in analysis and forecasting of flow-of-funds accounts, the federal budget and Federal Reserve operations. At Nomura Securities, among other duties, she developed various indicator forecasting tools and edited a daily global publication produced in London and New York for readers in Tokyo. At Haver Analytics, Carol was a member of the Research Department, aiding database managers with research and documentation efforts, as well as posting commentary on select economic reports. In addition, she conducted Ways-of-the-World, a blog on economic issues for an Episcopal-Church-affiliated website, The Geranium Farm. During her career, Carol served as an officer of the Money Marketeers and the Downtown Economists Club. She had a PhD from NYU's Stern School of Business. She lived in Brooklyn, New York, and had a weekend home on Long Island.


