 Global| Jul 14 2011
U.S. Budget Deficit Smaller than Forecast, But June Saw "Special Factors"
Summary
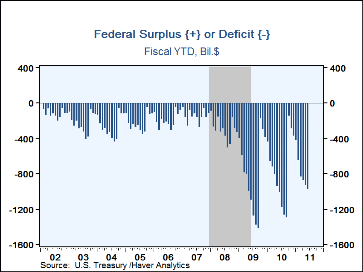
The U.S. Government ran a $43.1 billion budget deficit in June, putting fiscal 2011 to date at $970.5 billion, according to the U.S. Treasury's "Monthly Treasury Statement" released yesterday afternoon. Last year at this time, fiscal [...]
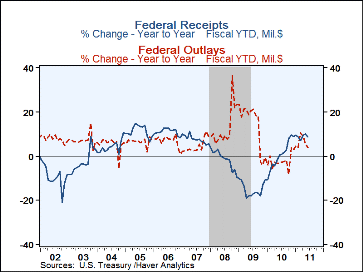
The U.S. Government ran a $43.1 billion budget deficit in June, putting fiscal 2011 to date at $970.5 billion, according to the U.S. Treasury's "Monthly Treasury Statement" released yesterday afternoon. Last year at this time, fiscal 2010's deficit was $1,004 billion. For this fiscal year to date, receipts (net of refunds) have been $1,734 billion, up 8.9% from the year earlier amount, while outlays have been $2,704.6 billion, up 4.0% from the 2010 cumulative amount. Forecasters had estimated the June monthly deficit at $65.5 billion, so the result was considerably more favorable, actually for a third consecutive month.
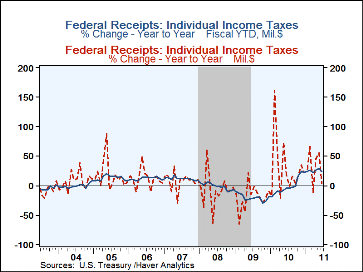
Among receipts, individual income taxes continue to grow relative to a year ago, with the year-to-date amount up by 24.3%. The increment for the month of June alone was 3.7%, but this seems to reflect irregular monthly movements rather than some pause; the May figure had been up 55.1%. Corporate income taxes eased to $48.8 billion from $51.5 billion a year ago; the year-to-date numbers are almost even, with a slim 1.0% increase this year. Social insurance taxes continue to run below year-ago amounts, reflecting the cut in the rate for social security contributions paid by individual employees.
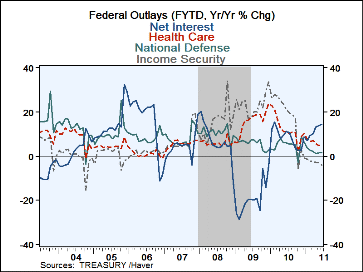
Reported outlays for the month of June are seen to be down 8.4% from June 2010, while as noted, the fiscal year-to-date amount is up 4.0%. The June figure was impacted by a credit of some $33 billion in the Department of Education, clearly a one-off item; expenditures in that department otherwise average about $7.5 billion a month. Among broader categories, defense spending is hovering just about 1.5% above a year ago. Welfare-oriented spending is declining, particularly for unemployment insurance, which was off 22.7% in June from the year earlier. Health care outlays are fairly erratic monthly, but the year-to-date amount is up about 5% from a year ago. Grants to states for Medicaid spiked, reaching $26.8 billion in June, the second largest monthly amount ever; last December was the very largest, at $28.3 billion. Net interest costs continue to accelerate, with June 20% higher than June 2010 and the year-to-date up 14.4%.
One interpretation one can glean in simply summarizing these data outcomes on the federal government budget in a given month is how very complex it is, both across departments at any point in time and also from one month to the next. During a week in which officials are trying to conjure ways to rein in the deficit, it seems little wonder that, even if they all agreed on specific policies, they would struggle devise meaningful and balanced schemes for bringing it all under predictable control. Since they don't agree to begin with, their task is daunting indeed.
Haver's basic data on Federal Government outlay and receipts and summary presentations of the Budget from both OMB and CBO are contained in USECON. Considerable detail, including the entire Monthly Treasury Statement, is given in the separate GOVFIN database.
| US Government Finance | Jun'11 | FY 2011 | FY 2010 | FY 2009 | FY 2008 | |
|---|---|---|---|---|---|---|
| thru June | thru June | Total | ||||
| Budget Balance | -$43.1 | -$970.5 | -$1,004.0 | -$1,294.1B | $-1,415.7B | $-454.8B |
| Net Revenues | 249.7 | 1,734.0 | 1,597.0 | 2,161.7 | 2,104.4 | 2,523.9 |
| (Y/Y % Change) | -0.6% | 8.9% | -0.5% | 2.7% | -16.6% | -1.7% |
| Individual Income Taxes | 3.7 | 24.3 | -4.4 | -1.8 | -20.1 | -1.5 |
| Corporate Income Taxes | -5.3 | 1.0 | 30.5 | 38.5 | -54.6 | -17.8 |
| Social Insurance Taxes | -4.7 | -5.1 | -3.9 | -2.9 | -1.0 | 3.5 |
| Net Outlays | $292.7 | $2,704.6 | $2,601.0 | $3455.9 | $3,520.1 | $2,978.7 |
| (Y/Y % Change) | -8.4% | 4.0% | -1.8% | -1.8% | 18.2% | 9.1% |
| Nat'l Defense | 1.7 | 1.5 | 5.9 | 5.0 | 7.6 | 11.8 |
| Health | 10.8 | 5.4 | 11.0 | 10.4 | 19.1 | 5.4 |
| Medicare | 7.1 | 4.3 | 4.9 | 5.0 | 10.1 | 4.1 |
| Income Security | -14.7 | -4.1 | 21.3 | 16.9 | 24.9 | 16.8 |
| Social Security | 3.4 | 3.5 | 3.4 | 3.5 | 10.7 | 5.3 |
| Interest | 20.0 | 14.4 | 11.1 | 3.3 | -24.5 | 6.3 |
Carol Stone, CBE
AuthorMore in Author Profile »Carol Stone, CBE came to Haver Analytics in 2003 following more than 35 years as a financial market economist at major Wall Street financial institutions, most especially Merrill Lynch and Nomura Securities. She has broad experience in analysis and forecasting of flow-of-funds accounts, the federal budget and Federal Reserve operations. At Nomura Securites, among other duties, she developed various indicator forecasting tools and edited a daily global publication produced in London and New York for readers in Tokyo. At Haver Analytics, Carol is a member of the Research Department, aiding database managers with research and documentation efforts, as well as posting commentary on select economic reports. In addition, she conducts Ways-of-the-World, a blog on economic issues for an Episcopal-Church-affiliated website, The Geranium Farm. During her career, Carol served as an officer of the Money Marketeers and the Downtown Economists Club. She has a PhD from NYU's Stern School of Business. She lives in Brooklyn, New York, and has a weekend home on Long Island.


