 Global| Dec 16 2020
U.S. Business Inventories and Sales Rise in October
Summary
• Business inventories increased 0.7% in October still 3.2% below February level. • Sales gain 0.9%, now 0.9% above January peak. • Inventory-to-Sales ratio edges down to six-year low of 1.31. Total business inventories grew 0.7% in [...]
• Business inventories increased 0.7% in October still 3.2% below February level.
• Sales gain 0.9%, now 0.9% above January peak.
• Inventory-to-Sales ratio edges down to six-year low of 1.31.
Total business inventories grew 0.7% in October (-4.0% year-on-year) after a slightly upwardly revised 0.8% increase in September (was 0.7%). After falling in the spring, inventories have been on the rise since July, though they are still 3.2% below their February level (inventories peaked in mid-2019). Total business sales gained 0.9% (2.2% y/y), the third consecutive increase of this magnitude. This puts sales 0.9% above their January peak. The inventory-to-sales (I/S) ratio ticked down to 1.31, a six-year low; in April the I/S ratio hit a 27-year high of 1.67. Manufacturing output as well as imports – neither of which are reported in this release – drive a wedge between inventories and sales. Factory production was up 1.1% in October, while goods imports jumped 2.1%.
Business inventory swings can have a meaningful impact on GDP. While inventories added 6.55 percentage point to GDP growth in the third quarter after a 3.50 percentage point drag in the second quarter. These were overshadowed by shifts in the final sales components such as consumption and investment. All of these factors are expected to moderate in the fourth quarter.
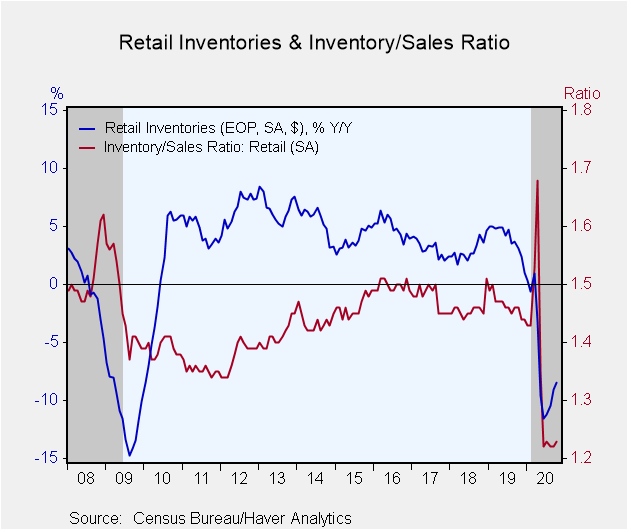
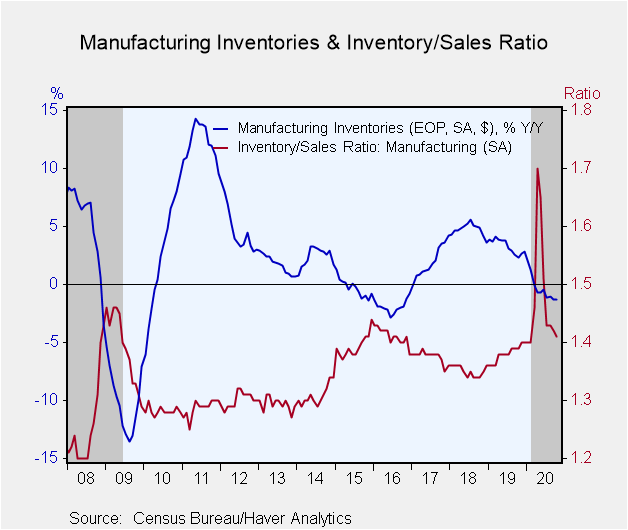
Retail inventories increased 0.9% in October (-8.5% y/y). Auto inventories, which comprise roughly 30% of retail inventories, grew 1.0% (-21.3% y/y). Non-auto retail inventories gained 0.8% (-1.5% y/y). General merchandise inventories, the second largest retail sector, was up 1.9% (-1.7% y/y). The troubled department store sector – a subset of general merchandise – saw inventories rise 1.3% (-13.4% y/y). Wholesale and factory sector inventories grew 1.1% and 0.2% respectively (-2.2% and -1.3% y/y).
Retail goods sales were revised down to unhanged in October (was 0.3%) and 8.3% y/y, with both non-auto and auto sales unchanged (7.7% and 10.4% y/y respectively). Note: the advanced retail goods sales data for November was released today showing a 0.8% decline (+7.1% y/y). Wholesale sector sales and shipments from the factories grew 1.8% and 1.0% respectively in October (0.9% and -2.1% y/y).
The inventory-to-sales ratio in the retail sector ticked up to 1.23 from last month's record low of 1.22 (data goes back to 1967). In April, the retail I/S ratio hit a 26-year high of 1.68. The non-auto I/S ratio edged up to 1.11 from its record low of 1.10. The wholesale and factory sector I/S ratios declined to the more typical levels of 1.31 and 1.41 respectively.
The manufacturing and trade, industrial production and international trade data are in Haver's USECON database. Detailed industrial production data can be found in the IP database.
| Manufacturing & Trade | Oct | Sep | Aug | Oct Y/Y | 2019 | 2018 | 2017 |
|---|---|---|---|---|---|---|---|
| Business Inventories (% chg) | 0.7 | 0.8 | 0.3 | -4.0 | 1.9 | 4.9 | 3.2 |
| Retail | 0.9 | 1.6 | 0.5 | -8.5 | 1.0 | 4.6 | 2.4 |
| Retail excl. Motor Vehicles | 0.8 | 1.0 | 0.5 | -1.5 | 1.9 | 3.7 | 2.2 |
| Merchant Wholesalers | 1.1 | 0.9 | 0.5 | -2.2 | 1.7 | 6.5 | 3.0 |
| Manufacturing | 0.2 | -0.1 | 0.0 | -1.3 | 2.8 | 3.6 | 4.2 |
| Business Sales (% chg) | |||||||
| Total | 0.9 | 0.9 | 0.9 | 2.2 | 1.6 | 5.9 | 5.3 |
| Retail | 0.0 | 1.7 | 1.1 | 8.3 | 3.3 | 4.2 | 4.6 |
| Retail excl. Motor Vehicle | 0.0 | 1.2 | 1.1 | 7.7 | 3.2 | 5.1 | 4.9 |
| Merchant Wholesalers | 1.8 | 0.4 | 1.2 | 0.9 | 0.6 | 6.8 | 6.7 |
| Manufacturing | 1.0 | 0.5 | 0.3 | -2.1 | 1.0 | 6.6 | 4.7 |
| I/S Ratio | |||||||
| Total | 1.31 | 1.32 | 1.32 | 1.40 | 1.39 | 1.36 | 1.38 |
| Retail | 1.23 | 1.22 | 1.22 | 1.46 | 1.46 | 1.46 | 1.48 |
| Retail excl. Motor Vehicles | 1.11 | 1.10 | 1.11 | 1.22 | 1.23 | 1.22 | 1.24 |
| Merchant Wholesalers | 1.31 | 1.32 | 1.31 | 1.35 | 1.34 | 1.28 | 1.30 |
| Manufacturing | 1.41 | 1.42 | 1.43 | 1.39 | 1.38 | 1.35 | 1.38 |
Gerald D. Cohen
AuthorMore in Author Profile »Gerald Cohen provides strategic vision and leadership of the translational economic research and policy initiatives at the Kenan Institute of Private Enterprise.
He has worked in both the public and private sectors focusing on the intersection between financial markets and economic fundamentals. He was a Senior Economist at Haver Analytics from January 2019 to February 2021. During the Obama Administration Gerald was Deputy Assistant Secretary for Macroeconomic Analysis at the U.S. Department of Treasury where he helped formulate and evaluate the impact of policy proposals on the U.S. economy. Prior to Treasury, he co-managed a global macro fund at Ziff Brothers Investments.
Gerald holds a bachelor’s of science from the Massachusetts Institute of Technology and a Ph.D. in Economics from Harvard University and is a contributing author to 30-Second Money as well as a co-author of Political Cycles and the Macroeconomy.
More Economy in Brief
 Global| Feb 05 2026
Charts of the Week: Balanced Policy, Resilient Data and AI Narratives
by:Andrew Cates


