 Global| Sep 15 2017
U.S. Business Inventories and Sales Rise the Same in July
by:Sandy Batten
|in:Economy in Brief
Summary
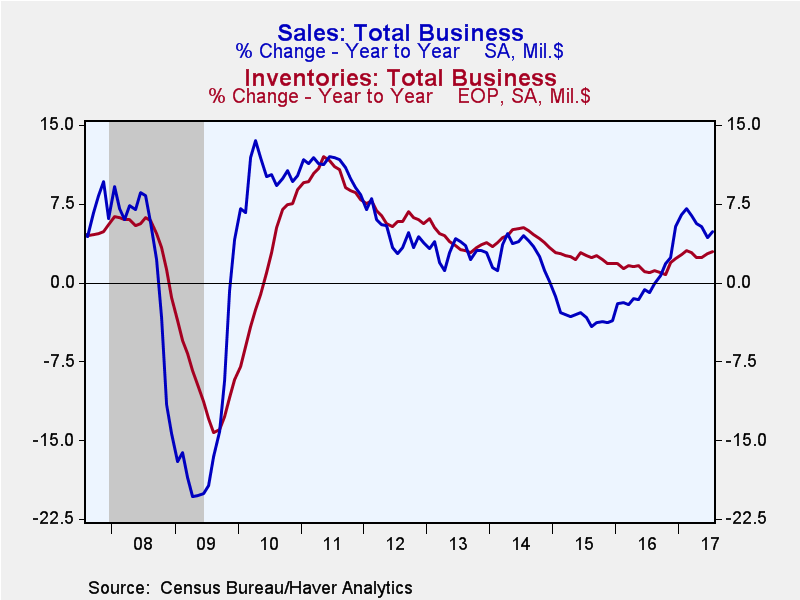
Total business inventories increased 0.2% in July (3.0% y/y) following a 0.5% m/m gain in June. Retail inventories slipped 0.1% m/m (3.4% y/y) in July after a 0.6% m/m jump in June. Motor vehicle and parts inventories were unchanged [...]
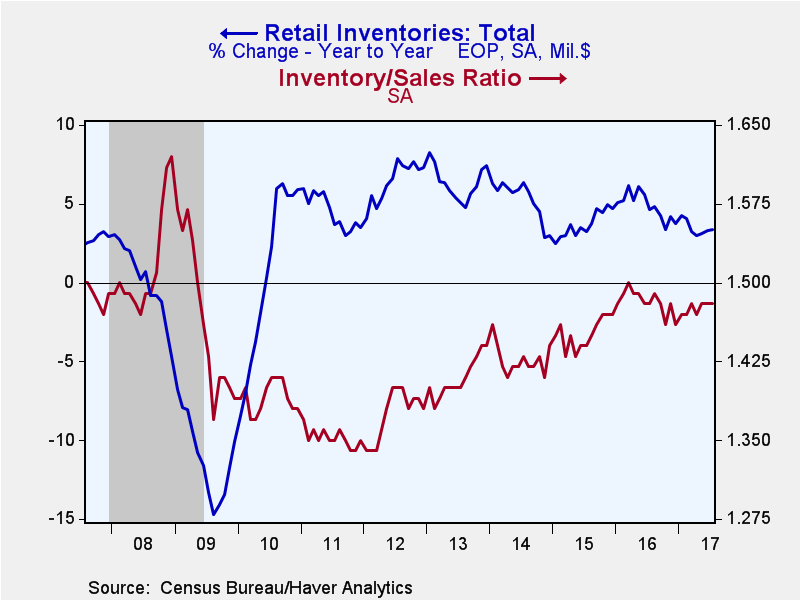
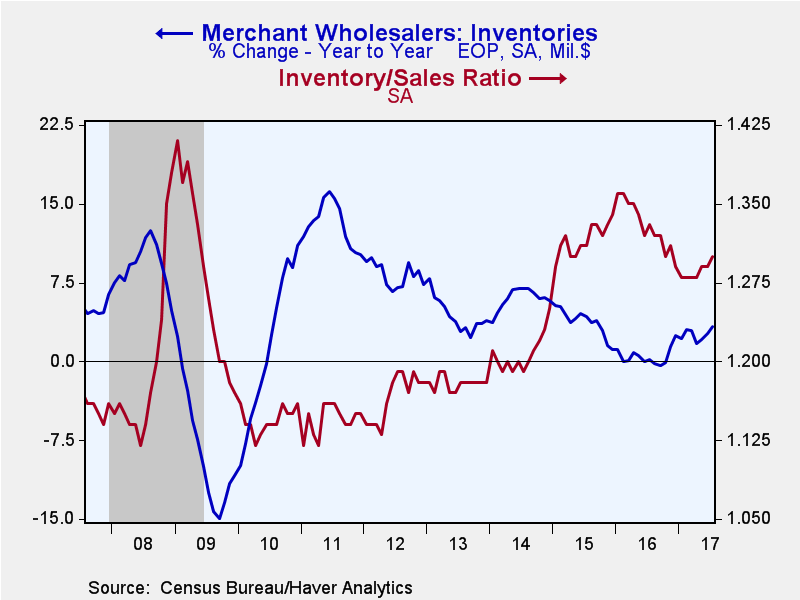
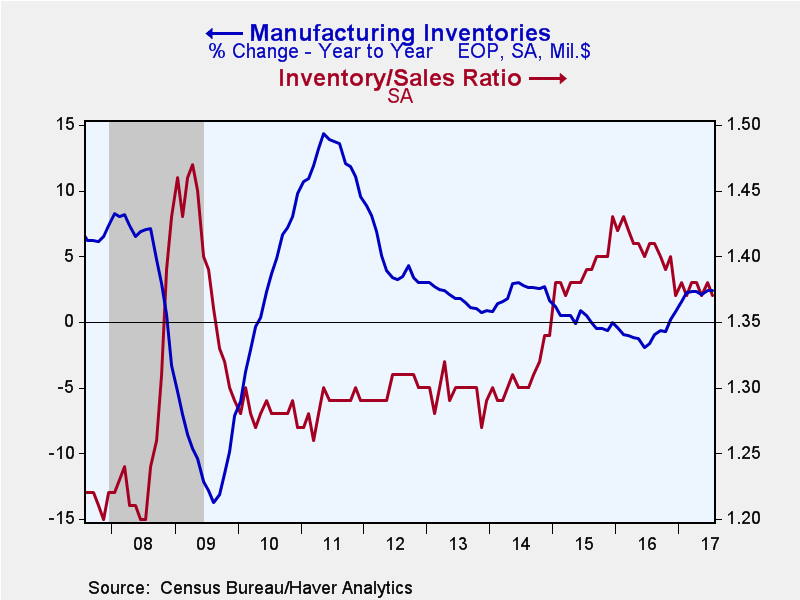
Total business inventories increased 0.2% in July (3.0% y/y) following a 0.5% m/m gain in June. Retail inventories slipped 0.1% m/m (3.4% y/y) in July after a 0.6% m/m jump in June. Motor vehicle and parts inventories were unchanged in July versus a 0.6% m/m surge in June but were still up 7.2% from a year earlier. Retail inventories excluding autos fell 0.2% m/m (+1.4% y/y) following a 0.5% m/m jump in June. A 0.6% m/m decline in inventories at general merchandise stores led the July decline. In contrast, inventories of building supplies surged 0.8% m/m in July. Wholesalers' inventories posted another sharp monthly increase, rising 0.6% m/m (3.3% y/y) in July, the same monthly gain as in June, while factory inventories rose 0.2% m/m (2.4% y/y) after a 0.3% m/m increase in June.
Business sales also increased 0.2% (4.9% y/y) in July, the same monthly gain as in June. Retail sales improved 0.3% (3.6% y/y), while excluding autos, sales rose 0.4% m/m (3.5% y/y). Wholesale sector sales slipped 0.1% m/m (5.9% y/y) in July following an outsized 0.6% m/m jump in June. Factory shipments rose 0.3% m/m (4.9% y/y) in July after an upwardly revised 0.1% increase in June.
In general, business sales continue to grow more rapidly than inventories though the gap has shrunk over the past several months. As a result, apart from the overall retail sector, inventory-to-sales ratios are lower now than they were a year ago. With sales and inventories exhibiting the same monthly increase in July, inventory-to-sales ratios were little changed from June. The business sector inventory-to-sales ratio was unchanged at 1.38. The retail I/S ratio held steady at 1.48, where it has been for most of this year. The I/S ratio for the retail sector excluding autos edged down to 1.24 in July from 1.25, while the I/S ratio for the auto sector remained elevated at 2.26. The general merchandise store I/S ratio slipped to 1.40 in July from 1.41 in June; it has flattened out over the past several months after having trended down since the beginning of 2016. The wholesale sector's I/S ratio edged up to 1.30 from 1.29, and the manufacturing I/S ratio slipped to 1.37 in July from 1.38. The manufacturing I/S ratio has been very stable for all of 2017.
The manufacturing and trade data are in Haver's USECON database.
| Manufacturing & Trade | Jul | Jun | May | Jul Y/Y | 2016 | 2015 | 2014 |
|---|---|---|---|---|---|---|---|
| Business Inventories (% chg) | 0.2 | 0.5 | 0.3 | 3.0 | 2.3 | 1.8 | 3.4 |
| Retail | -0.1 | 0.6 | 0.6 | 3.4 | 3.8 | 4.7 | 3.0 |
| Retail excl. Motor Vehicles | -0.2 | 0.5 | 0.2 | 1.4 | 1.8 | 3.8 | 2.6 |
| Merchant Wholesalers | 0.6 | 0.6 | 0.6 | 3.3 | 2.5 | 1.2 | 5.8 |
| Manufacturing | 0.2 | 0.3 | -0.2 | 2.4 | 0.8 | -0.1 | 1.6 |
| Business Sales (% chg) | |||||||
| Total | 0.2 | 0.2 | 0.1 | 4.9 | -0.1 | -3.2 | 2.8 |
| Retail | 0.3 | -0.1 | 0.0 | 3.6 | 2.7 | 1.9 | 4.0 |
| Retail excl. Motor Vehicles | 0.4 | -0.2 | -0.3 | 3.5 | 2.3 | 0.4 | 3.3 |
| Merchant Wholesalers | -0.1 | 0.6 | -0.1 | 5.9 | -0.4 | -4.9 | 3.6 |
| Manufacturing | 0.3 | 0.1 | 0.3 | 4.9 | -2.0 | -5.8 | 1.3 |
| I/S Ratio | |||||||
| Total | 1.38 | 1.38 | 1.37 | 1.40 | 1.40 | 1.38 | 1.31 |
| Retail | 1.48 | 1.48 | 1.48 | 1.48 | 1.48 | 1.45 | 1.43 |
| Retail excl. Motor Vehicles | 1.24 | 1.25 | 1.24 | 1.27 | 1.27 | 1.26 | 1.23 |
| Merchant Wholesalers | 1.30 | 1.29 | 1.29 | 1.33 | 1.33 | 1.32 | 1.21 |
| Manufacturing | 1.37 | 1.38 | 1.37 | 1.41 | 1.41 | 1.39 | 1.31 |
Sandy Batten
AuthorMore in Author Profile »Sandy Batten has more than 30 years of experience analyzing industrial economies and financial markets and a wide range of experience across the financial services sector, government, and academia. Before joining Haver Analytics, Sandy was a Vice President and Senior Economist at Citibank; Senior Credit Market Analyst at CDC Investment Management, Managing Director at Bear Stearns, and Executive Director at JPMorgan. In 2008, Sandy was named the most accurate US forecaster by the National Association for Business Economics. He is a member of the New York Forecasters Club, NABE, and the American Economic Association. Prior to his time in the financial services sector, Sandy was a Research Officer at the Federal Reserve Bank of St. Louis, Senior Staff Economist on the President’s Council of Economic Advisors, Deputy Assistant Secretary for Economic Policy at the US Treasury, and Economist at the International Monetary Fund. Sandy has taught economics at St. Louis University, Denison University, and Muskingun College. He has published numerous peer-reviewed articles in a wide range of academic publications. He has a B.A. in economics from the University of Richmond and a M.A. and Ph.D. in economics from The Ohio State University.


