 Global| Jul 14 2015
U.S. Business Inventories Continue Modest Growth Trend, Mixed by Sector
Summary
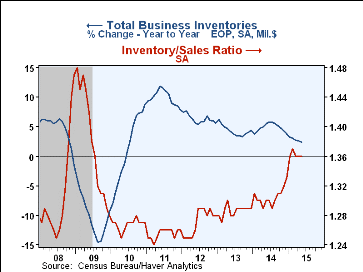
Total business inventories rose 0.3% in May (2.4% y/y) following an unrevised 0.4% gain in April. The consequent 3-month growth was 3.2% (AR), sustaining April's improved pace. Total business sales in May increased 0.4% (-2.2% y/y) [...]
Total business inventories rose 0.3% in May (2.4% y/y) following an unrevised 0.4% gain in April. The consequent 3-month growth was 3.2% (AR), sustaining April's improved pace. Total business sales in May increased 0.4% (-2.2% y/y) after April's 0.5% increased, which was revised down slightly. The May gain raised the 3-month change to 6.2% (AR), its best since May 2014. As a result, the overall inventory/sales ratio for May held at 1.36, maintaining the expansion-high range of 1.36-1.37 that has prevailed during all the months of 2015.
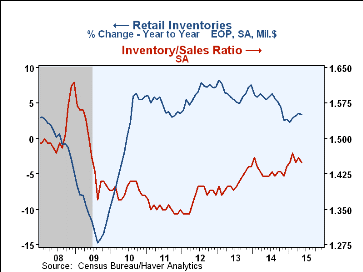
Retailers' inventories were virtually unchanged in May (3.4% y/y) and the three-month growth rate slowed to 3.8% (AR) from 5.8% in April. General merchandise stores' inventories rose 0.5% (2.2% y/y) after April's 1.6% surge; they are up at a 5.3% rate over the last 3 months. Auto inventories fell 0.2% (+5.0% y/y/) after April's 0.9% gain; their 3-month growth was 5.9% through May. Clothing inventories edged up 0.1% (4.8% y/y), also a 5.9% annual rate during the last 3 months. Furniture inventories declined 0.3% (-1.1% y/y) and were down at a 7.3% rate from 3 months ago. Building materials and garden supply stores had a 0.2% rise in inventories, making 4.4% y/y and 3.9% annualized 3-month growth.
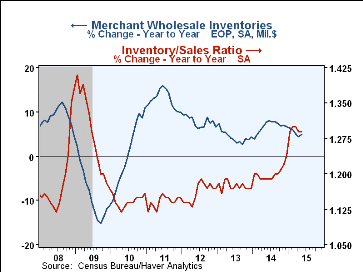
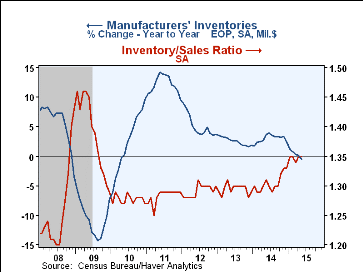
Merchant wholesale inventories rose 0.8% (5.0% y/y) in May. The 3-month growth rate picked up to 5.8% following a period of growth near 3%. Manufacturers' inventories were almost exactly unchanged in May (-0.6% y/y) after April's 0.2% rise. May's 3-month growth was 0.5% (AR), somewhat slower than the previous month's 0.8% pace.
Total business sales rose 0.4% in May (-2.2% y/y), a third consecutive monthly increase after seven months of declines. This brought the annualized 3-month growth rate to 6.2%. This increase included May's strong 1.1% gain in retail sales (+1.6% y/y), which were reported today to have retreated in June. Wholesale sales were up 0.3% in May (-3.8% y/y); with April's 1.7% increase, the 3-month growth came to 6.8% in May. Factory shipments were off 0.1% (-3.7% y/y) in May and grew 1.9% over the last 3 months.
The total business inventory-to-sales ratio remained stable, as noted above, at 1.36 in May, and there has been stability in the three major sectors over recent months as well. Retailers' I/S ratio was 1.45 in May, down from 1.46 in April, with the earlier months of the year at 1.46-1.47. Wholesalers' ratio is hovering around 1.29-1.30, and that for manufacturers at 1.35. For manufacturers and wholesalers, these ratios are distinctly higher than the entire post-recession period through the end of 2014, and for retailers these readings are modestly above those of the 2009-2014 span.
The manufacturing and trade data are in Haver's USECON database.
| Manufacturing & Trade (%) | May | Apr | Mar | May Y/Y | 2014 | 2013 | 2012 |
|---|---|---|---|---|---|---|---|
| Business Inventories | 0.3 | 0.4 | 0.1 | 2.4 | 3.8 | 4.4 | 5.7 |
| Retail | 0.0 | 0.6 | 0.3 | 3.4 | 2.7 | 7.6 | 7.3 |
| Retail excl. Motor Vehicles | 0.1 | 0.5 | 0.1 | 2.6 | 2.2 | 5.0 | 3.0 |
| Merchant Wholesalers | 0.8 | 0.4 | 0.2 | 5.0 | 6.7 | 4.2 | 6.6 |
| Manufacturing | 0.0 | 0.2 | -0.1 | -0.6 | 2.4 | 1.9 | 3.8 |
| Business Sales (%) | |||||||
| Total | 0.4 | 0.5 | 0.6 | -2.2 | 3.4 | 3.0 | 5.0 |
| Retail | 1.1 | -0.1 | 1.6 | 1.6 | 3.6 | 3.9 | 4.8 |
| Retail excl. Motor Vehicles | 0.9 | -0.3 | 1.1 | -0.3 | 2.5 | 2.7 | 3.8 |
| Merchant Wholesalers | 0.3 | 1.7 | -0.3 | -3.8 | 4.3 | 3.1 | 5.9 |
| Manufacturing | -0.1 | -0.0 | 0.5 | -3.7 | 2.5 | 2.1 | 4.4 |
| I/S Ratio | |||||||
| Total | 1.36 | 1.36 | 1.36 | 1.30 | 1.31 | 1.29 | 1.27 |
| Retail | 1.45 | 1.46 | 1.45 | 1.42 | 1.43 | 1.41 | 1.38 |
| Retail Excl. Motor Vehicles | 1.27 | 1.28 | 1.27 | 1.23 | 1.24 | 1.23 | 1.21 |
| Merchant Wholesalers | 1.29 | 1.29 | 1.30 | 1.19 | 1.20 | 1.18 | 1.16 |
| Manufacturing | 1.35 | 1.35 | 1.34 | 1.31 | 1.31 | 1.30 | 1.29 |
Carol Stone, CBE
AuthorMore in Author Profile »Carol Stone, CBE came to Haver Analytics in 2003 following more than 35 years as a financial market economist at major Wall Street financial institutions, most especially Merrill Lynch and Nomura Securities. She had broad experience in analysis and forecasting of flow-of-funds accounts, the federal budget and Federal Reserve operations. At Nomura Securities, among other duties, she developed various indicator forecasting tools and edited a daily global publication produced in London and New York for readers in Tokyo. At Haver Analytics, Carol was a member of the Research Department, aiding database managers with research and documentation efforts, as well as posting commentary on select economic reports. In addition, she conducted Ways-of-the-World, a blog on economic issues for an Episcopal-Church-affiliated website, The Geranium Farm. During her career, Carol served as an officer of the Money Marketeers and the Downtown Economists Club. She had a PhD from NYU's Stern School of Business. She lived in Brooklyn, New York, and had a weekend home on Long Island.
More Economy in Brief
 Global| Feb 05 2026
Charts of the Week: Balanced Policy, Resilient Data and AI Narratives
by:Andrew Cates


