 Global| Jun 14 2019
U.S. Business Inventories Rise in April as Sales Decline
Summary
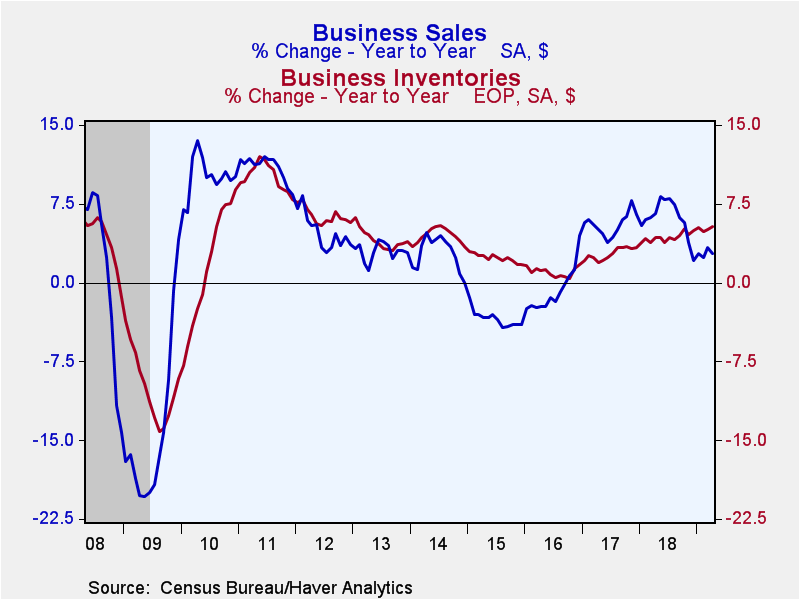
Total business inventories increased 0.5% (5.3% year-on-year) during April, after being unchanged in March (unrevised). Total business sales decreased 0.2% (+2.8% y/y) following a 1.3% gain (revised down from 1.6%). The inventory-to- [...]
Total business inventories increased 0.5% (5.3% year-on-year) during April, after being unchanged in March (unrevised). Total business sales decreased 0.2% (+2.8% y/y) following a 1.3% gain (revised down from 1.6%). The inventory-to-sales (I/S) ratio ticked up to 1.39 from an upwardly-revised 1.38. Business inventory swings can have a meaningful impact on GDP. In the first quarter inventories added 0.6 percentage point to GDP growth.
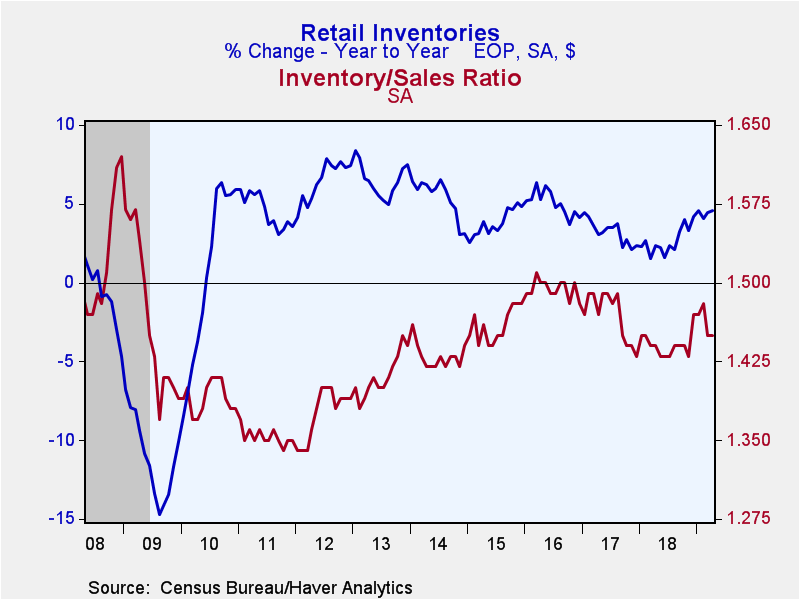
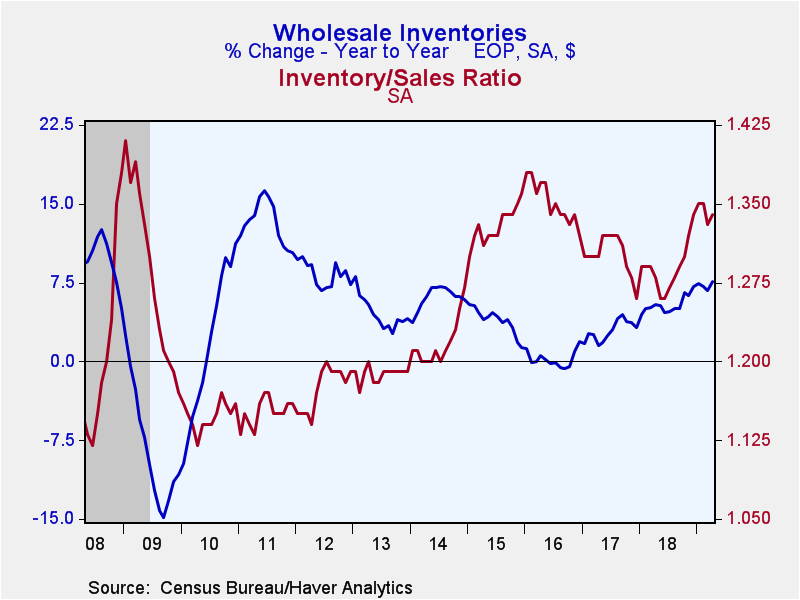
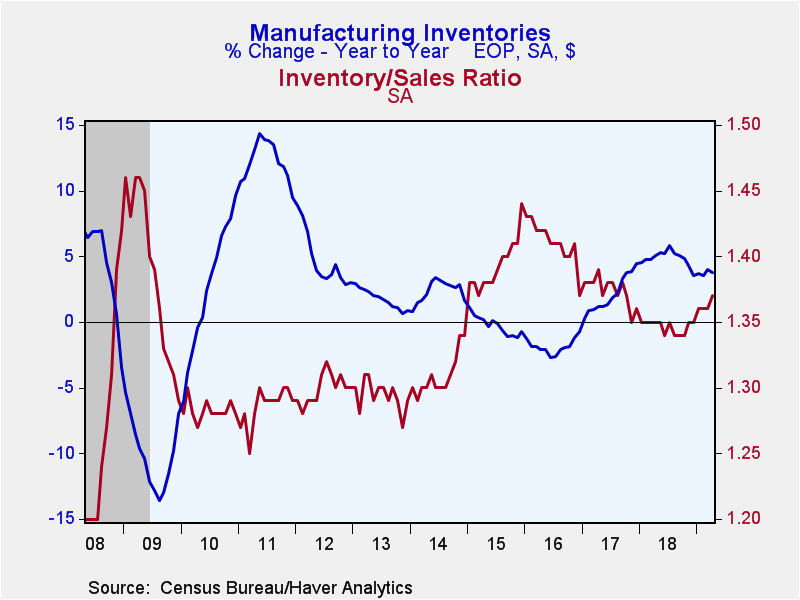
Retail inventories increased 0.5% (4.6% y/y) in April after declining 0.3%. Auto inventories, which comprise roughly 35% of retail inventories, grew 0.8% (8.2% y/y). Non-auto retail inventories rose 0.4% (2.6% y/y). General merchandise inventories, the second largest sector were unchanged (+0.1% y/y). The troubled department store sector – a subset of general merchandise – saw inventories down 1.4% (-7.7% y/y). Factory sector inventories gained 0.3% (3.8% y/y). As reported last week, wholesale inventories were up 0.8% (7.6% y/y).
Retail sales increased an upwardly-revised 0.3% in April (was -0.2%) and 3.5% y/y, with non-auto sales growing 0.5% (3.6% y/y). Note: the advanced retail sales data for May was released today showing a 0.5% gain (3.1% y/y). Wholesale sector sales declined 0.4% in April (+2.7% y/y), while shipments from the factory sector were down 0.5% (+2.2% y/y).
The inventory-to-sales ratio in the retail sector was unchanged at 1.45. The non-auto I/S ratio ticked up down to 1.19, slightly above the historic low of 1.17 reached in November 2018 (data goes back to 1967). The wholesale and factory sector I/S ratios edged up to 1.34 and 1.37 respectively.
The manufacturing and trade data are in Haver's USECON database.
| Manufacturing & Trade | Apr | Mar | Feb | Y/Y | 2018 | 2017 | 2016 |
|---|---|---|---|---|---|---|---|
| Business Inventories (% chg) | 0.53 | 0.05 | 0.29 | 5.30 | 4.92 | 3.37 | 1.70 |
| Retail | 0.53 | -0.26 | 0.16 | 4.61 | 4.22 | 2.36 | 4.10 |
| Retail excl. Motor Vehicles | 0.39 | -0.05 | 0.38 | 2.60 | 1.25 | 2.16 | 1.95 |
| Merchant Wholesalers | 0.82 | -0.02 | 0.41 | 7.63 | 7.14 | 3.26 | 1.90 |
| Manufacturing | 0.26 | 0.41 | 0.31 | 3.78 | 3.52 | 4.46 | -0.71 |
| Business Sales (% chg) | |||||||
| Total | -0.23 | 1.27 | 0.11 | 2.77 | 6.09 | 5.57 | -0.80 |
| Retail | 0.29 | 1.87 | -0.36 | 3.49 | 4.72 | 4.96 | 2.55 |
| Retail excl. Motor Vehicles | 0.52 | 1.46 | -0.41 | 3.64 | 5.35 | 4.97 | 2.01 |
| Merchant Wholesalers | -0.40 | 1.82 | 0.31 | 2.73 | 6.54 | 6.72 | -1.30 |
| Manufacturing | -0.53 | 0.19 | 0.34 | 2.18 | 6.89 | 4.98 | -3.17 |
| I/S Ratio | |||||||
| Total | 1.39 | 1.38 | 1.39 | 1.36 | 1.36 | 1.38 | 1.42 |
| Retail | 1.45 | 1.45 | 1.48 | 1.44 | 1.44 | 1.47 | 1.49 |
| Retail excl. Motor Vehicles | 1.19 | 1.20 | 1.21 | 1.21 | 1.20 | 1.24 | 1.28 |
| Merchant Wholesalers | 1.34 | 1.33 | 1.35 | 1.28 | 1.29 | 1.30 | 1.35 |
| Manufacturing | 1.37 | 1.36 | 1.36 | 1.35 | 1.35 | 1.37 | 1.41 |
Gerald D. Cohen
AuthorMore in Author Profile »Gerald Cohen provides strategic vision and leadership of the translational economic research and policy initiatives at the Kenan Institute of Private Enterprise.
He has worked in both the public and private sectors focusing on the intersection between financial markets and economic fundamentals. He was a Senior Economist at Haver Analytics from January 2019 to February 2021. During the Obama Administration Gerald was Deputy Assistant Secretary for Macroeconomic Analysis at the U.S. Department of Treasury where he helped formulate and evaluate the impact of policy proposals on the U.S. economy. Prior to Treasury, he co-managed a global macro fund at Ziff Brothers Investments.
Gerald holds a bachelor’s of science from the Massachusetts Institute of Technology and a Ph.D. in Economics from Harvard University and is a contributing author to 30-Second Money as well as a co-author of Political Cycles and the Macroeconomy.
More Economy in Brief
 Global| Feb 05 2026
Charts of the Week: Balanced Policy, Resilient Data and AI Narratives
by:Andrew Cates


