 Global| Jan 16 2020
U.S. Business Inventories Slip While Sales Rise
Summary
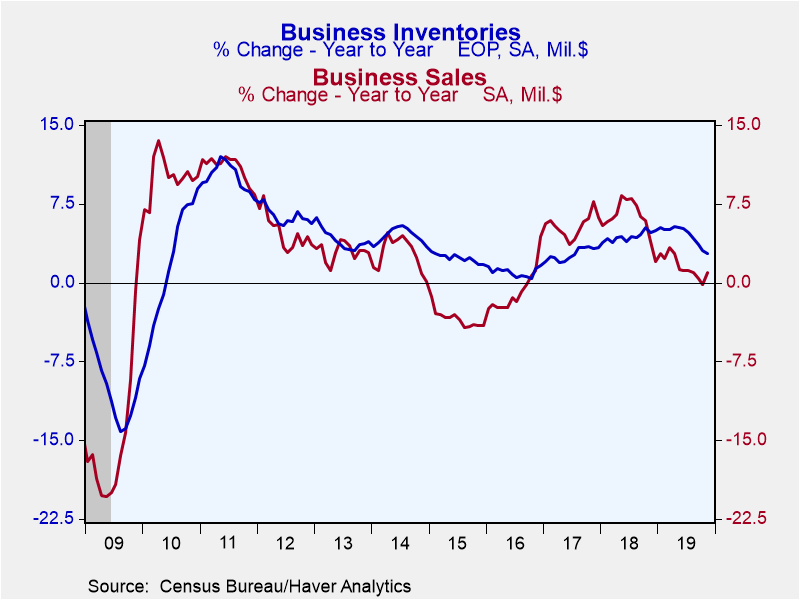
A month ago, the headline here was the exact opposite: "Inventories Rise While Sales Slip." So that October condition reversed in November: total business inventories decreased 0.2% (2.8% y/y) after October's 0.1% rise, as November [...]
A month ago, the headline here was the exact opposite: "Inventories Rise While Sales Slip." So that October condition reversed in November: total business inventories decreased 0.2% (2.8% y/y) after October's 0.1% rise, as November sales rebounded 0.7% (1.0% y/y) after falling 0.2% in October. The inventory-to-sales (I/S) ratio edged down to 1.39 from the 1.40 that had held since May.
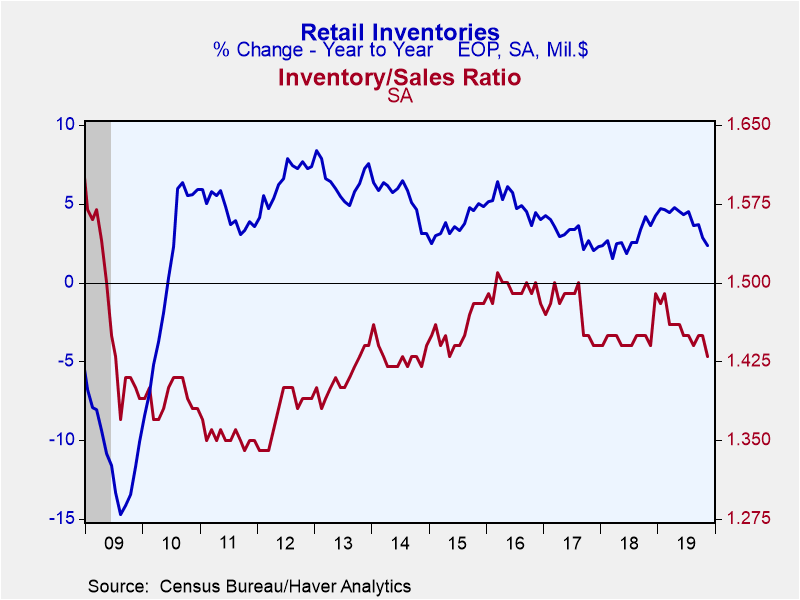
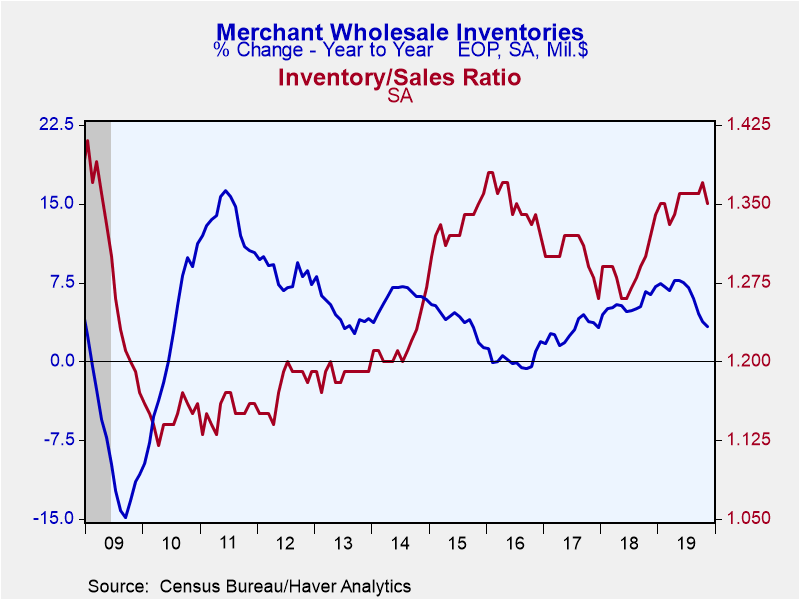
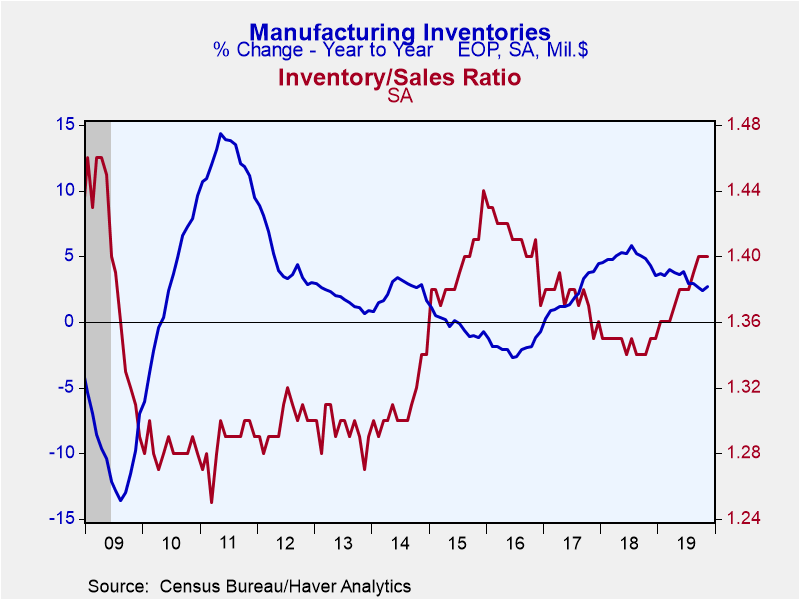
Retail inventories dropped 0.8% (2.3% y/y) in November after two modest monthly increases of 0.1%. Motor vehicle dealers' stocks declined 1.8% in November (0.6% y/y) after a 0.7% decrease in October. Nonauto inventories also decreased in November, edging 0.2% lower (3.3% y/y) after October's 0.5% increase. Inventories of furniture & home furnishings fell 0.6% (0.3% y/y) following a jump of 1.2% in October. Clothing inventories edged down 0.2% (unchanged y/y); they have fallen 0.2%-0.3% for the last four months. General merchandise store inventories fell 0.3% (-0.9% y/y) for a second month; that included a 1.6% drop in department store stocks. Wholesale inventories edged down 0.1% (+3.3% y/y), reversing October's 0.1% increase. Factory sector inventories rose 0.3% (2.7% y/y) in November after a 0.2% increase.
Sales of retail stores (not including the food service sector) were up 0.4% in November (3.1% y/y), a second such monthly increase, which was repeated in December. Excluding auto dealers, retail sales edged up just 0.1% (2.1% y/y) in November after a 0.2% rise. Wholesale sector sales gained 1.5% (0.8% y/y), rebounding after their October drop of 0.9%. Shipments from the factory sector increased 0.3% (-0.8% y/y) following their slim 0.1% October rise.
The inventory-to-sales ratio in the retail sector declined to 1.43 in November from 1.45; the 1.43 is the lowest since a similar ratio in May 2015. The ratio for retailers excluding auto dealers was 1.19 for a third consecutive month. That for wholesalers was 1.35, down from 1.37. And among manufacturers, it was 1.40 for a third month.
The manufacturing and trade data are in Haver's USECON database.
| Manufacturing & Trade | Nov | Oct | Sep | Nov Y/Y | 2018 | 2017 | 2016 |
|---|---|---|---|---|---|---|---|
| Business Inventories (% chg) | -0.2 | 0.1 | -0.1 | 2.8 | 4.9 | 3.4 | 1.7 |
| Retail | -0.8 | 0.1 | 0.1 | 2.3 | 4.2 | 2.4 | 4.0 |
| Retail excl. Motor Vehicles | -0.2 | 0.5 | 0.2 | 3.3 | 1.7 | 2.0 | 2.0 |
| Merchant Wholesalers | -0.1 | 0.1 | -0.7 | 3.3 | 7.1 | 3.3 | 1.9 |
| Manufacturing | 0.3 | 0.3 | 0.3 | 2.7 | 3.5 | 4.5 | -0.7 |
| Business Sales (% chg) | |||||||
| Total | 0.7 | -0.2 | -0.4 | 1.0 | 6.1 | 5.4 | -0.8 |
| Retail | 0.4 | 0.4 | -0.6 | 3.1 | 4.6 | 4.5 | 2.4 |
| Retail excl. Motor Vehicles | 0.1 | 0.2 | -0.4 | 2.1 | 5.3 | 4.8 | 1.9 |
| Merchant Wholesalers | 1.5 | -0.9 | -0.1 | 0.8 | 6.5 | 6.7 | -1.3 |
| Manufacturing | 0.3 | 0.1 | -0.4 | -0.8 | 6.9 | 5.0 | -3.2 |
| I/S Ratio | |||||||
| Total | 1.39 | 1.40 | 1.40 | 1.37 | 1.36 | 1.38 | 1.42 |
| Retail | 1.43 | 1.45 | 1.45 | 1.44 | 1.45 | 1.47 | 1.49 |
| Retail excl. Motor Vehicles | 1.19 | 1.19 | 1.19 | 1.17 | 1.20 | 1.24 | 1.28 |
| Merchant Wholesalers | 1.35 | 1.37 | 1.36 | 1.32 | 1.29 | 1.30 | 1.35 |
| Manufacturing | 1.40 | 1.40 | 1.40 | 1.35 | 1.35 | 1.37 | 1.41 |
Carol Stone, CBE
AuthorMore in Author Profile »Carol Stone, CBE came to Haver Analytics in 2003 following more than 35 years as a financial market economist at major Wall Street financial institutions, most especially Merrill Lynch and Nomura Securities. She had broad experience in analysis and forecasting of flow-of-funds accounts, the federal budget and Federal Reserve operations. At Nomura Securities, among other duties, she developed various indicator forecasting tools and edited a daily global publication produced in London and New York for readers in Tokyo. At Haver Analytics, Carol was a member of the Research Department, aiding database managers with research and documentation efforts, as well as posting commentary on select economic reports. In addition, she conducted Ways-of-the-World, a blog on economic issues for an Episcopal-Church-affiliated website, The Geranium Farm. During her career, Carol served as an officer of the Money Marketeers and the Downtown Economists Club. She had a PhD from NYU's Stern School of Business. She lived in Brooklyn, New York, and had a weekend home on Long Island.


