 Global| Aug 12 2011
U.S. Business Inventory Growth Slows in June
Summary
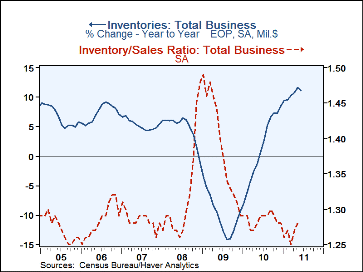
The U.S. Commerce Department reported that business inventory growth slowed in June to 0.3% from 0.9% in May (revised from 1.0%). Business sales increased 0.4% in June, turning back higher following a 0.1% decrease in May. With the [...]
The U.S. Commerce Department reported that business inventory growth slowed in June to 0.3% from 0.9% in May (revised from 1.0%). Business sales increased 0.4% in June, turning back higher following a 0.1% decrease in May. With the moderation in stock growth, the inventory/sales ratio stabilized at 1.28, after rising in both May and April. At end-June, inventories were 11.1% higher than June 2010, and June's sales were up 12.4% from the year ago.
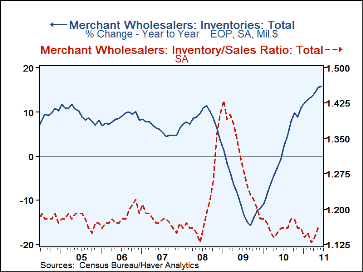
Wholesalers again showed the largest inventory gain among the major distribution sectors, at 0.6%. However, this is much more moderate than the sizable 1.7% in May and the 1% or larger increases in that sector every month beginning last December. The lesser expansion owed mainly to an outright decline in petroleum stocks, which fell 4.0% in June alone. Other nondurable goods inventories edged up 0.2% and durable goods inventories increased 1.3%, with notable advances in motor vehicles, computers, metals and machinery.
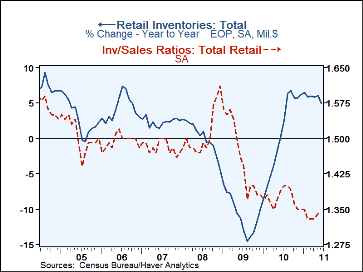
In the retail sector, an upturn in sales contributed to a smaller advance in inventories. Sales in June rose 0.4% after a 0.2% decline in May. Retailers' inventories rose just 0.2%, compared with May's 0.4% rise. General merchandise and building material stocks actually fell, while furniture, food and clothing stores all saw moderate increases. Motor vehicle dealers saw a slim 0.1% increase in stocks. Inventory/sales ratios moved little in the sector, up or down 0.01 among store groups, except building materials, whose sales gain cut their I/S ratio by 0.03. However, their sales retreated anew in July so the lower I/S may be temporary.
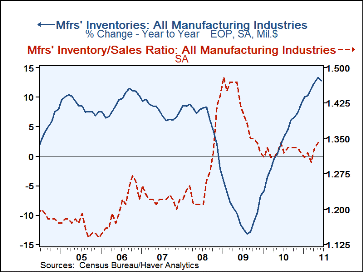
Manufacturers' inventories were up 0.2% in June, the smallest monthly increase since May 2010. The smaller rise kept the factory I/S ratio at 1.34, the same as the upwardly revised May figure (originally reported as 1.32).
The manufacturing and trade data are in Haver's USECON database. Note that in a value-added feature, the database includes series calculated by Haver database managers showing sales, inventories and I/S ratios for total business less motor vehicle dealers and related wholesale operations.
|
Business Inventories (%) |
Jun | May | Apr | Mar | June Y/Y | 2010 | 2009 | 2008 |
|---|---|---|---|---|---|---|---|---|
| Total | 0.3 | 0.9 | 1.0 | 1.3 | 11.1 | 8.6 | -9.3 | -1.2 |
| Retail | 0.2 | 0.4 | 0.2 | 1.0 | 5.0 | 6.1 | -10.0 | -4.4 |
| Retail excl. Motor Vehicles | 0.2 | 0.4 | 0.2 | 1.0 | 4.5 | 3.7 | -4.7 | -3.0 |
| Merchant Wholesalers | 0.6 | 1.7 | 1.1 | 1.3 | 15.8 | 11.0 | -11.8 | 3.7 |
| Manufacturing | 0.2 | 0.8 | 1.5 | 1.4 | 12.8 | 8.7 | -6.8 | -4.1 |
| Business Sales (%) | ||||||||
| Total | 0.4 | -0.1 | 0.1 | 2.4 | 12.4 | 9.3 | -14.6 | 2.3 |
| Retail | 0.3 | -0.2 | 0.3 | 0.7 | 8.9 | 6.8 | -7.8 | -1.6 |
| Retail excl. Motor Vehicles | 0.2 | 0.2 | 0.5 | 1.2 | 8.4 | 6.1 | -6.3 | 2.1 |
| Merchant Wholesalers | 0.6 | -0.3 | 0.5 | 3.0 | 15.4 | 12.6 | -16.1 | 5.9 |
| Manufacturing | 0.2 | 0.0 | -0.4 | 3.1 | 12.8 | 8.6 | -18.5 | 2.3 |
| I/S Ratio | ||||||||
| Total | 1.28 | 1.28 | 1.27 | 1.25 | 1.29 | 1.28 | 1.39 | 1.32 |
| Retail | 1.34 | 1.34 | 1.33 | 1.33 | 1.39 | 1.37 | 1.46 | 1.51 |
| Retail Excl. Motor Vehicles | 1.19 | 1.19 | 1.19 | 1.19 | 1.24 | 1.23 | 1.30 | 1.29 |
| Merchant Wholesalers | 1.16 | 1.16 | 1.14 | 1.13 | 1.16 | 1.16 | 1.30 | 1.21 |
| Manufacturing | 1.34 | 1.32 | 1.33 | 1.23 | 1.34 | 1.33 | 1.41 | 1.27 |
Carol Stone, CBE
AuthorMore in Author Profile »Carol Stone, CBE came to Haver Analytics in 2003 following more than 35 years as a financial market economist at major Wall Street financial institutions, most especially Merrill Lynch and Nomura Securities. She had broad experience in analysis and forecasting of flow-of-funds accounts, the federal budget and Federal Reserve operations. At Nomura Securities, among other duties, she developed various indicator forecasting tools and edited a daily global publication produced in London and New York for readers in Tokyo. At Haver Analytics, Carol was a member of the Research Department, aiding database managers with research and documentation efforts, as well as posting commentary on select economic reports. In addition, she conducted Ways-of-the-World, a blog on economic issues for an Episcopal-Church-affiliated website, The Geranium Farm. During her career, Carol served as an officer of the Money Marketeers and the Downtown Economists Club. She had a PhD from NYU's Stern School of Business. She lived in Brooklyn, New York, and had a weekend home on Long Island.


