 Global| Dec 31 2013
U.S. Case-Shiller Home Price Index Firms More; Strongest Since 2006
Summary
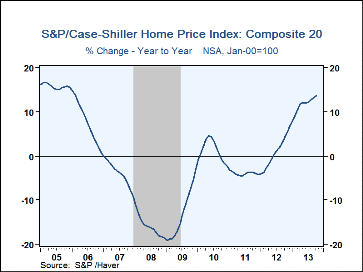
The seasonally adjusted Case-Shiller 20- City Home Price Index rose 1.0% in both September and October, making the twelve-month increase 13.6%, its greatest since February 2006. The 3-month annualized rate of increase had slowed [...]
 The seasonally adjusted Case-Shiller 20- City Home Price Index rose 1.0% in
both September and October, making the twelve-month increase 13.6%, its greatest
since February 2006. The 3-month annualized rate of increase had slowed during
the summer, to 10.5% through August, but it picked back up in October to 12.5%.
Home prices in the narrower 10-city group also gained 1.0% in October (also 13.6%
y/y). Not adjusted for normal seasonal variation, the Case-Shiller 20-City Home
Price Index inched up 0.2% in October after a 0.7% increase during September.
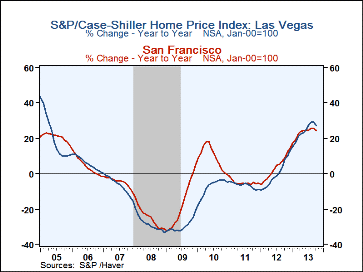
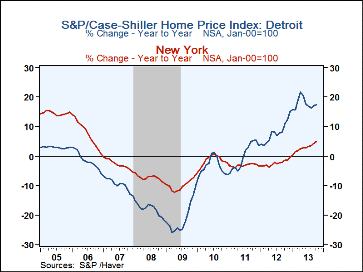
Among individual cities, prices seem to have moderated a bit in the West, with Las Vegas showing a 27.1% rise y/y, down from a high of 29.2% in August and San Francisco edging down to 24.6% in the latest reading from 25.7% in September. The Las Vegas price level bottomed in March 2012 and now stands 41.6% above that, though, of course, still 45.8% below the August 2006 peak. Prices have firmed elsewhere in the country, with even Detroit showing a 17.3% y/y gain and standing 47.0% above their April 2011 trough.
The Case-Shiller home price series is value-weighted, i.e., a greater index weight is assigned to more expensive homes. It is a three-month moving average and is calculated using the "repeat sales method," where the item measured is the price change for a specific house compared to the price for that same house the last time it sold. The nation-wide S&P/Case-Shiller home price indexes can be found in Haver's USECON database, and the city data highlighted below are in the REGIONAL database.
| S&P Case-Shiller Home Price Index (SA, %) | Oct | Sept | Aug | Oct Y/Y |
2012 | 2011 | 2010 |
|---|---|---|---|---|---|---|---|
| 20 City Composite Index | 1.0 | 1.0 | 0.9 | 13.6 | 0.9 | -3.9 | 1.3 |
| Regional Indicators | |||||||
| Las Vegas | 0.6 | 1.6 | 2.2 | 27.1 | -0.3 | -6.5 | -7.7 |
| San Francisco | 0.6 | 1.4 | 0.9 | 24.6 | 3.5 | -4.9 | 9.3 |
| Los Angeles | 1.5 | 1.2 | 1.7 | 22.1 | 0.7 | -3.4 | 5.3 |
| San Diego | 0.7 | 1.2 | 1.5 | 19.7 | 1.2 | -4.4 | 7.3 |
| Phoenix | 1.1 | 1.4 | 1.3 | 18.1 | 13.9 | -7.3 | -0.3 |
| Atlanta | 1.8 | 2.0 | 1.7 | 19.0 | -7.8 | -7.0 | -2.4 |
| Detroit | 1.8 | 1.3 | 0.5 | 17.3 | 8.0 | 0.0 | -3.4 |
| Tampa | 0.9 | 1.0 | 1.5 | 15.2 | 2.7 | -6.6 | -4.0 |
| Miami | 1.9 | 1.1 | 0.6 | 15.8 | 5.1 | -4.9 | -2.1 |
| Seattle | 0.5 | 0.7 | 0.6 | 13.1 | 2.1 | -6.6 | -3.6 |
| Portland | 0.4 | 1.0 | 1.1 | 12.6 | 1.7 | -7.1 | -3.2 |
| Minneapolis | 1.6 | 0.9 | 1.1 | 11.4 | 6.0 | -8.2 | 3.2 |
| Denver | 0.3 | 0.8 | 0.7 | 9.5 | 4.5 | -2.1 | 0.9 |
| Dallas | 1.0 | 0.9 | 0.9 | 9.7 | 3.2 | -2.4 | 0.1 |
| Chicago | 0.8 | 0.7 | 0.1 | 10.9 | -2.8 | -6.8 | -3.7 |
| Charlotte | 1.2 | 0.4 | 0.8 | 8.8 | 1.7 | -3.6 | -3.4 |
| Boston | 0.9 | 1.1 | 0.6 | 8.6 | 0.5 | -2.0 | 1.9 |
| Washington, D.C. | 0.6 | 0.8 | 0.4 | 7.5 | 2.1 | -0.4 | 4.7 |
| Cleveland | 0.8 | 1.4 | 0.1 | 4.9 | 0.0 | -4.3 | 0.7 |
| New York | 0.9 | 0.5 | 0.3 | 4.9 | -2.3 | -3.1 | -1.5 |
Carol Stone, CBE
AuthorMore in Author Profile »Carol Stone, CBE came to Haver Analytics in 2003 following more than 35 years as a financial market economist at major Wall Street financial institutions, most especially Merrill Lynch and Nomura Securities. She had broad experience in analysis and forecasting of flow-of-funds accounts, the federal budget and Federal Reserve operations. At Nomura Securities, among other duties, she developed various indicator forecasting tools and edited a daily global publication produced in London and New York for readers in Tokyo. At Haver Analytics, Carol was a member of the Research Department, aiding database managers with research and documentation efforts, as well as posting commentary on select economic reports. In addition, she conducted Ways-of-the-World, a blog on economic issues for an Episcopal-Church-affiliated website, The Geranium Farm. During her career, Carol served as an officer of the Money Marketeers and the Downtown Economists Club. She had a PhD from NYU's Stern School of Business. She lived in Brooklyn, New York, and had a weekend home on Long Island.
More Economy in Brief
 Global| Feb 05 2026
Charts of the Week: Balanced Policy, Resilient Data and AI Narratives
by:Andrew Cates


